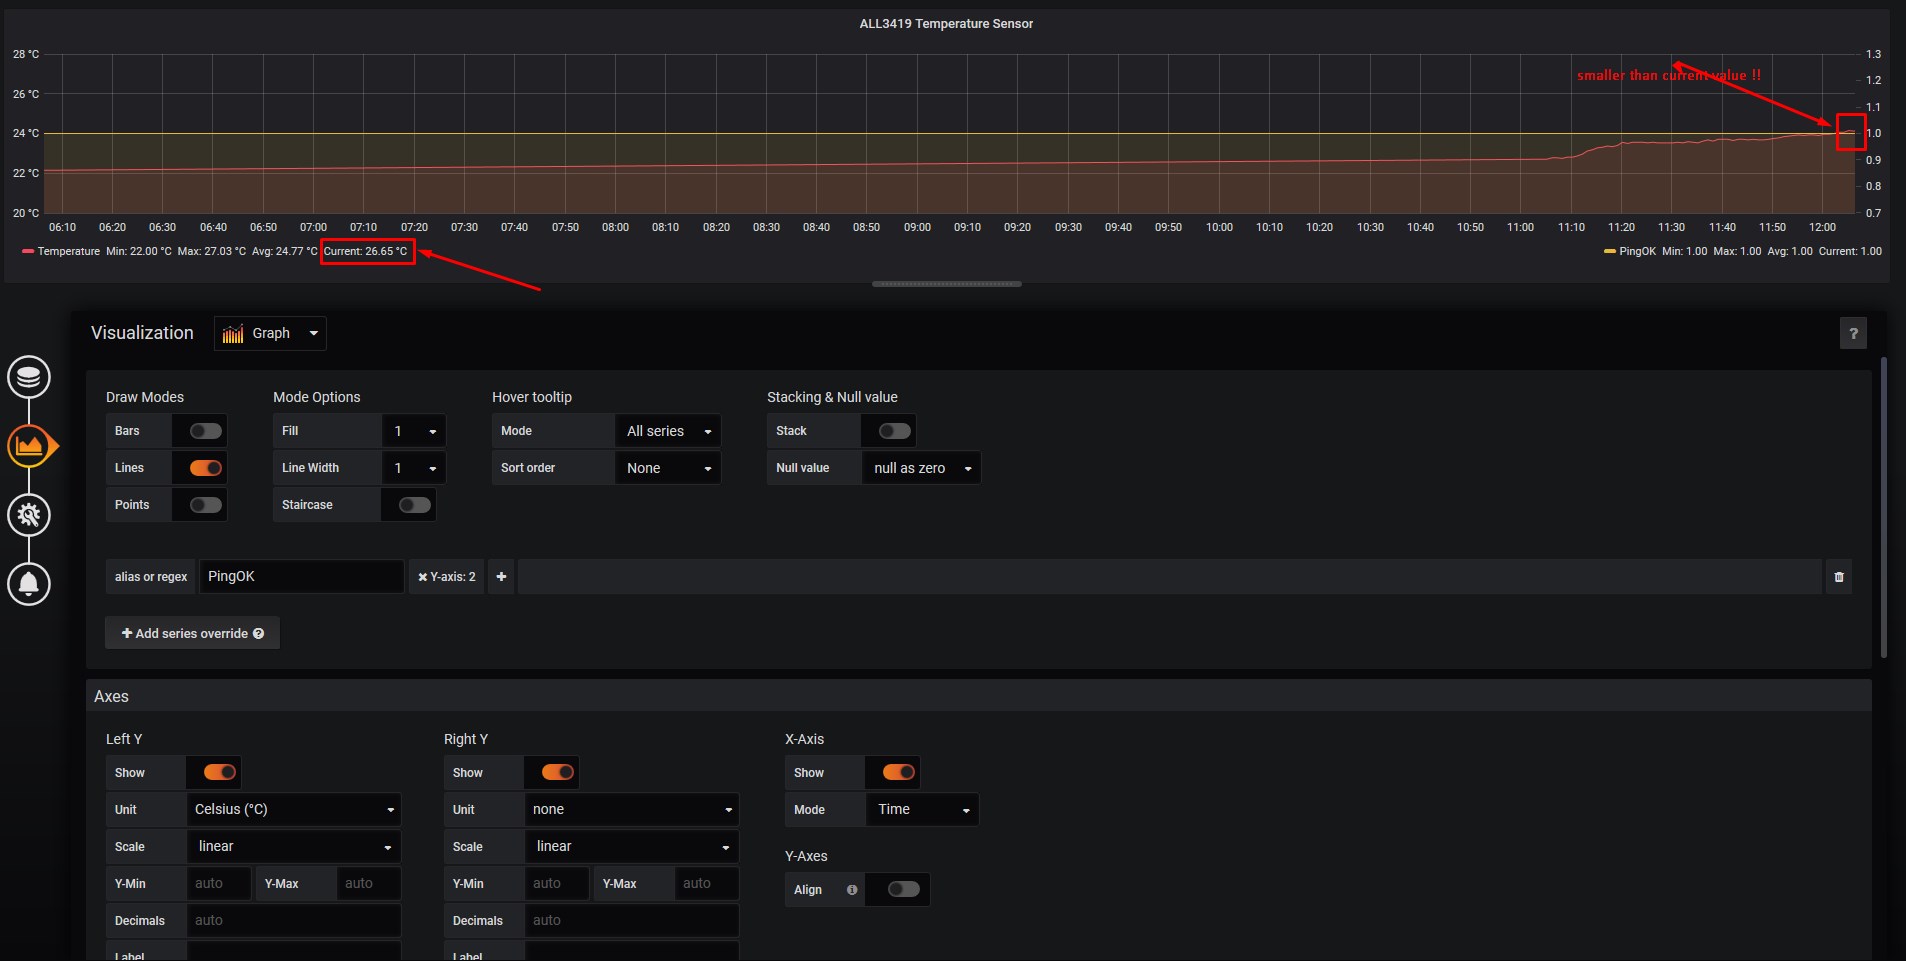
As you can see in the screenshot, the value from the blue line doesn’t match the value you can see when hovering.
Also, if in the legend i select the blue (so that only blue gets shown) line it gets displayed normally, but when all get displayed at the same time this happens. Does it have something to do with my query? or could you please help me find the problem?
I think is correct - just not very intuitive in this case due to the ordering of the series.
If you sum all the values (26.83 + 3.05 + 3.15 + 3.55 + 1.55 + 1.10) it is equal to 39.23 which is what you see in on your graph. The blue line does have the value 3.05 but it is stacked on top of the line with the value 26.83.
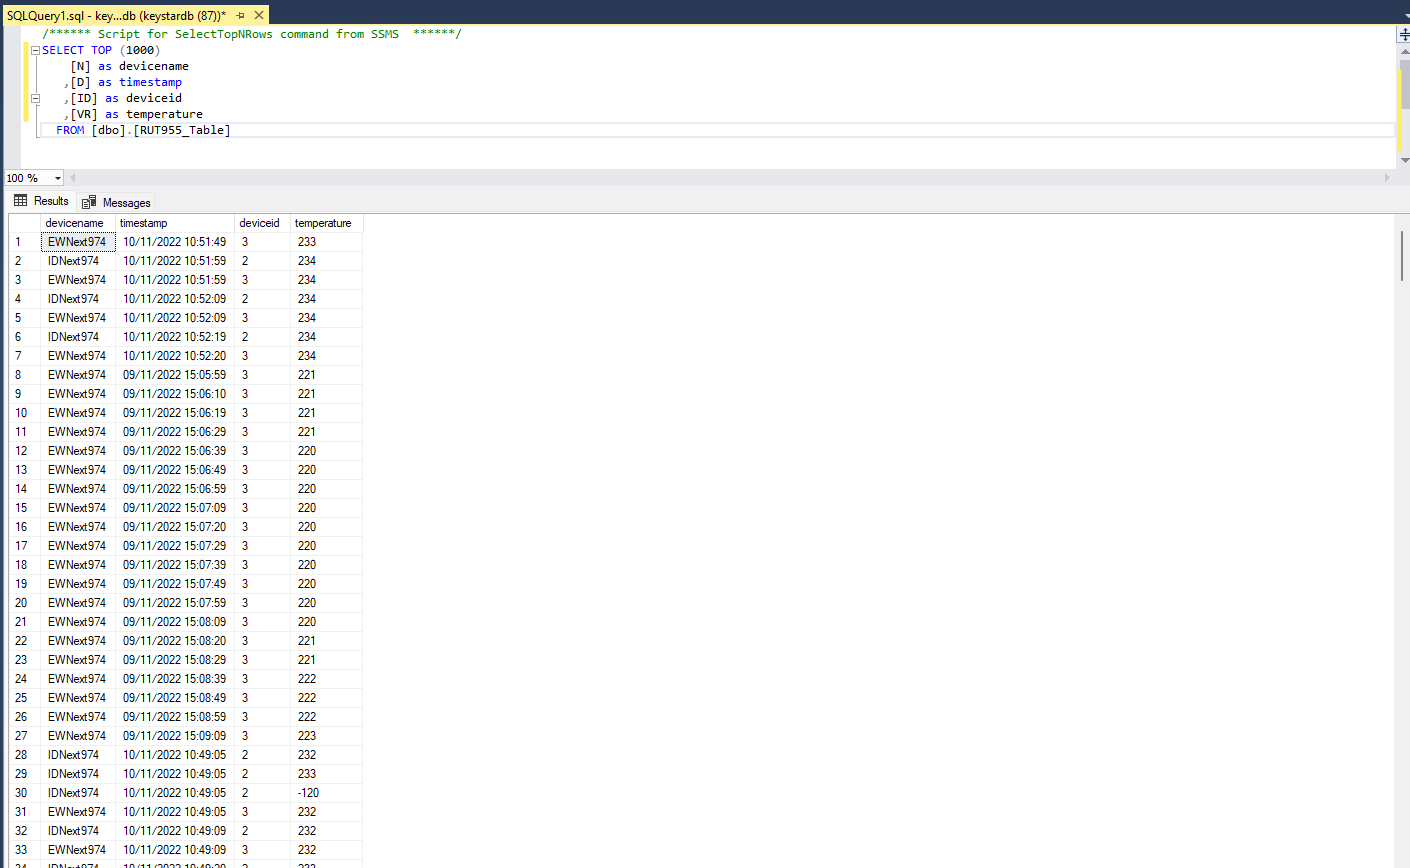
I am using MS SQL as my source data
The query looks like this:
SELECT
TIMESTAMP as time,
CONVERT(NUMERIC(4,2), Temperature) as Temperature,
CASE WHEN PingOk = ‘true’ THEN 1 ELSE 0 END as PingOK
FROM
[DaVinciATE_stb_01_dev].[dbo].[T_All3419]
Executing this query in MS SQL Management Studio brings the following results:
I am using Graph but the current value (which is the correct value) is higher than what is displayed on the graph.
I checked the ‘Display’ tab but I did not find any thing un-usual.
Show us what the query looks like in Grafana (on the Query tab) and what the query inspector shows.
Are the timestamps on the graph correct? What range have you set the display to?
Are the timestamps on the graph correct? What range have you set the display to?
from the query inspector, I noticed that the timestamps are converted into unix time, and some of the values has " ." comma in it…May be this is the problem! As mentioned in Grafana MS SQL document Grafana support standard MS SQL time format.
I tried ‘$__timeEpoch’ but it does not make any difference. The current value is still not displayed
SELECT
$__timeEpoch(TIMESTAMP),
CONVERT(NUMERIC(4,2), Temperature) as Temperature,
CASE WHEN PingOk = ‘true’ THEN 1 ELSE 0 END as PingOK
FROM
[DaVinciATE_stb_01_dev].[dbo].[T_All3419]
I imagine that is just rounding error. Presumably comma is your system’s decimal point separator.
Have you checked that the numbers are what you expect. For example, the first one, 1563383309443, is 23rd July 2019 10:28:26 GMT. Is that what you expect? And was the temperature 26.12 at that time?
something is wrong, I uploaded the “Query Inspector” file on 22nd July, How come the unix time points to 23rd July !?
This means Grafana does not convert Time from MS SQL correctly, therefore I can not see any points on the graph
I recently out of a sudden faced the same problem with time series graph on one of the nodes monitored by zabbix. The data in the query and on the legend is correct but the graph representation is not. What helped me: I changed graph type to XY chart and then back to time series.Grafana v9.3.2
And here is example of how it looked: