Using day as x-axis instead of time

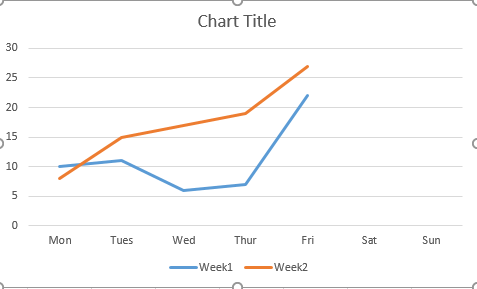
Would like to have a set non-month/year specific days as the x-axis, as in: 01, 02, 03, 04, etc…

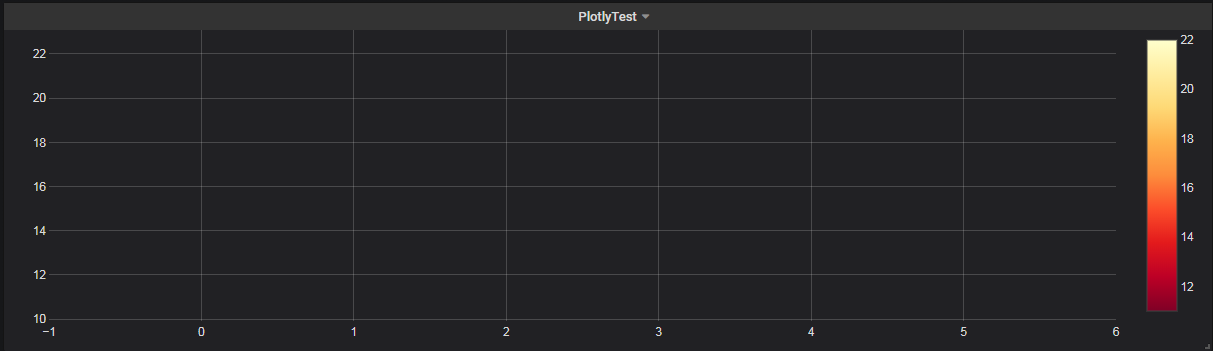
When I used a time macro (unixEpochFilter) and valid time (or time_sec) column, the graph I get is not ideal. I would like to have a single colored bar, but as it stands each day gets it’s own color

When I attempt to execute a query without a time macro (or other valid time column) I get an error: Found no column named time or time_sec

I do have X-axis Mode ‘Series’ selected

Here is my query:
select
$__unixEpochGroupAlias(timestamp,$__interval), FROM_UNIXTIME(timestamp, “%e”) as “day”, count(*) as “severity”
from event_table
WHERE
$__unixEpochFilter(timestamp) AND
severity > 0 AND
gateway = CONCAT(‘$gateway’,‘_Prod’) AND
FROM_UNIXTIME(timestamp, “%a”) NOT IN (‘Sat’) AND
headline NOT IN (‘samplingStatus’) AND
description NOT IN (‘NetProbe disconnected’, ‘NetProbe unreachable’) AND
dataview NOT IN (‘GW Gateway Data’, ‘GW Probe Data’, ‘GW Snooze Data’)
GROUP BY 1, 2
ORDER BY $__unixEpochGroup(timestamp,$__interval)

Can someone please help?

1 Like

You can try Plotly

I’m trying to not set up a secondary analytics tool at this point. We are really just exploring Grafana as an enterprise option and I don’t want to invest in additional vendor products at this point.

Plotly is a plugin of grafana

I tried it, it did not work. Still hamstrung by “needing” a “time” column, which makes each day of the week appear as its own series.

If I understand you well, ‘simply’ you want to have the same color for every day, you could use the graph you show and in series override put a color for all the series:

You can also achieve something similar with plotly,
your query may or may not return a column of time,
with plotly, you can do the query as timeserie,
or as a table, in the first case you will need the time column, in the second you do not need it, in any case, plotly allows you to plot a column on the X axis and a different column on the Y axis.

I hope to be helpful, if I still can not understand you, please give me more details

1 Like

Thanks Daniel. The Series Override does make sense and for display purposes on this series is good. However, my goal is to have two separate time series on the same graph. The reason I want the DAY as the x-axis is so I can have two weeks display. Basically, like this:

image

As for Plotly. I’ve tried it, and I just get weird errors and no data displays at all, in either the time series or table options. Here is the query/response that was used for the table data. As you can see there is data return, but the panel is blank

{
  "xhrStatus": "complete",
  "request": {
"method": "POST",
"url": "api/tsdb/query",
"data": {
  "from": "1548859160744",
  "to": "1549463960744",
  "queries": [
    {
      "refId": "A",
      "intervalMs": 600000,
      "maxDataPoints": 960,
      "datasourceId": 10,
      "rawSql": "select \nFROM_UNIXTIME(timestamp, \"%a\") as \"Day\", count(*) as \"Count\"\nfrom event_table  \nWHERE\n  $__unixEpochFilter(timestamp) AND\n  severity > 0 AND\n  gateway = CONCAT('MLPX','_Prod') AND\n  FROM_UNIXTIME(timestamp, \"%a\") NOT IN ('Sat') AND\n  headline NOT IN ('samplingStatus') AND\n  description NOT IN ('NetProbe disconnected', 'NetProbe unreachable') AND\n  dataview NOT IN ('GW Gateway Data', 'GW Probe Data', 'GW Snooze Data')\nGROUP BY 1\nORDER BY 1\n",
      "format": "table"
    }
  ]
}
  },
  "response": {
"results": {
  "A": {
    "refId": "A",
    "meta": {
      "rowCount": 6,
      "sql": "select \nFROM_UNIXTIME(timestamp, \"%a\") as \"Day\", count(*) as \"Count\"\nfrom event_table  \nWHERE\n  timestamp >= 1548859160 AND timestamp <= 1549463960 AND\n  severity > 0 AND\n  gateway = CONCAT('MLPX','_Prod') AND\n  FROM_UNIXTIME(timestamp, \"%a\") NOT IN ('Sat') AND\n  headline NOT IN ('samplingStatus') AND\n  description NOT IN ('NetProbe disconnected', 'NetProbe unreachable') AND\n  dataview NOT IN ('GW Gateway Data', 'GW Probe Data', 'GW Snooze Data')\nGROUP BY 1\nORDER BY 1\n"
    },
    "series": null,
    "tables": [
      {
        "columns": [
          {
            "text": "Day"
          },
          {
            "text": "Count"
          }
        ],
        "rows": [
          [
            "Fri",
            16
          ],
          [
            "Mon",
            21
          ],
          [
            "Sun",
            12
          ],
          [
            "Thu",
            22
          ],
          [
            "Tue",
            11
          ],
          [
            "Wed",
            12
          ]
        ]
      }
    ]
  }
}
  }
}

Mmmm I think it is not possible to solve your use case with grafana,
it’s sad because it’s a very simple problem

Agree. This seems like a bit of a gap. Grafana is a powerful tool but when looking through the lens of performance metrics, not having a mechanism to overlay multiple time ranges into the same graph is a bit weird. If Excel can do it…

Anyway, thanks so much for trying!

2 Likes