Grafana version v9.3.1 and OS - Windows 10
I want to create a Line Chart in which X-axis contain timestamp and Y-axis should contain another column having some date.
I tried using Timeseries chart type and in Format of Query i use table because timeseries format in query is giving error saying :
convert value to float failed: metricIndex 1 type *time.Time can’t be converted to float
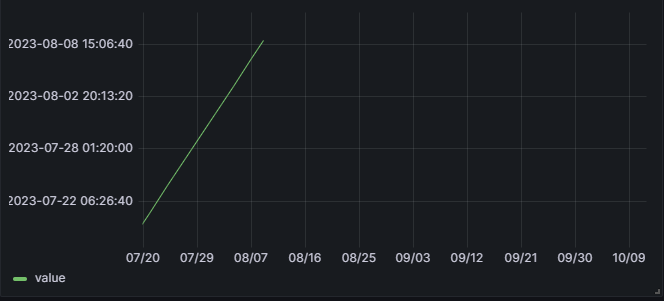
But now in table format i am not getting error but now i am facing issue in visualization as “Value1” column in data type is date but instead I am getting it as unix_timestamp format

I want the x-axis should also looks similar to y-axis
Database - MySQL
Query - SELECT UNIX_TIMESTAMP(timestamp) as “time”, PlannedDate as “Value1” FROM Table1 WHERE $__timeFilter(timestamp) and ID = 1
GROUP BY 1 , 2
I tried using Graph(Old) plugin also but then I am not getting correct values on Y-axis

Could you please help in getting this issue resolve…
Thanks you.