- What Grafana version and what operating system are you using?
Grafana v12.0.2 (5bda17e7c1), Debian 12
- What are you trying to achieve?
Show rates in the graph, while showing totals for selected time period in the legend. For example, showing network traffic as (m/k/)bytes / sec on the graph, but have total “xx GB” in the legend.
My source data uses totals (bytes, watt-hours, etc.), where each point represents usage since the last point; but I can format the query differently using $__interval_ms to change it to be average rates too (bytes/sec, watts) if that matters.
- How are you trying to achieve it?
Include “Total” under “Legend > Values”
- What happened?
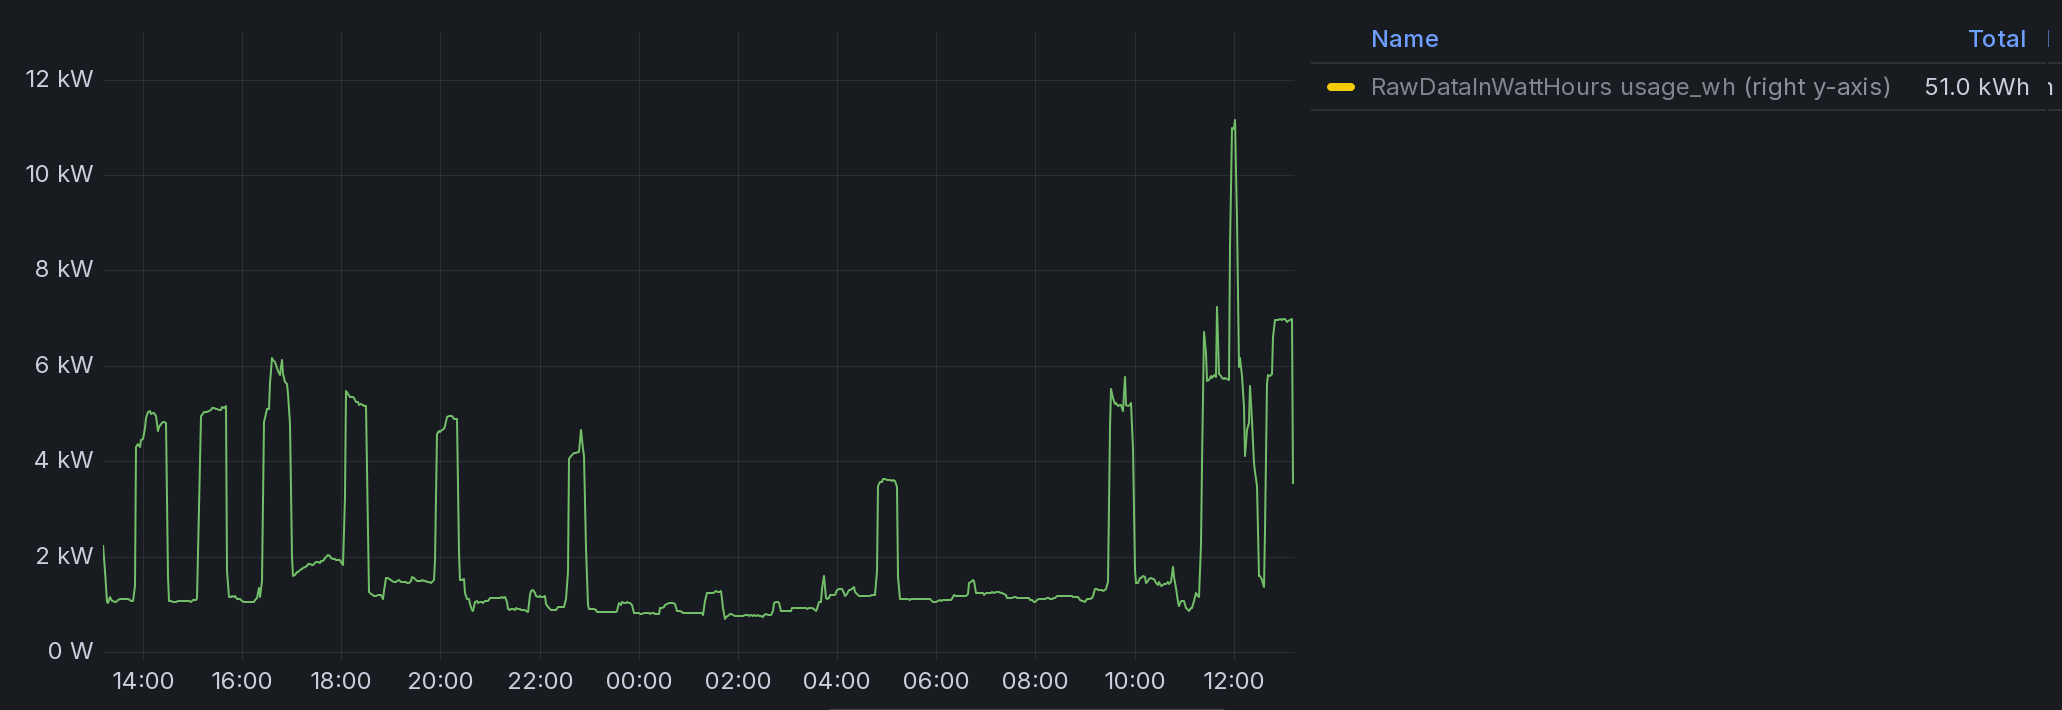
I had to pick between either seeing “bytes”/“Wh” in the graph (per $__interval) but having correct GB/kWh totals, or seeing “bytes/sec”/“watts” in the graph but having meaningless totals (total = 1.53 MW, for example).
- What did you expect to happen?
Some way to either use bytes+watt-hours in the data, and divide the graph+tooltip values by $__interval, or use bytes/sec+watts in the data, and multiply the legend total by a time unit
- Can you copy/paste the configuration(s) that you are having problems with?
{
  "id": 1,
  "type": "timeseries",
  "title": "New panel",
  "gridPos": {
    "x": 0,
    "y": 0,
    "h": 8,
    "w": 12
  },
  "fieldConfig": {
    "defaults": {
      "custom": {
        "drawStyle": "line",
        "lineInterpolation": "linear",
        "barAlignment": 0,
        "barWidthFactor": 0.6,
        "lineWidth": 1,
        "fillOpacity": 0,
        "gradientMode": "none",
        "spanNulls": false,
        "insertNulls": false,
        "showPoints": "auto",
        "pointSize": 5,
        "stacking": {
          "mode": "none",
          "group": "A"
        },
        "axisPlacement": "auto",
        "axisLabel": "",
        "axisColorMode": "text",
        "axisBorderShow": false,
        "scaleDistribution": {
          "type": "linear"
        },
        "axisCenteredZero": false,
        "hideFrom": {
          "tooltip": false,
          "viz": false,
          "legend": false
        },
        "thresholdsStyle": {
          "mode": "off"
        }
      },
      "color": {
        "mode": "palette-classic"
      },
      "mappings": [],
      "thresholds": {
        "mode": "absolute",
        "steps": [
          {
            "value": null,
            "color": "green"
          },
          {
            "value": 80,
            "color": "red"
          }
        ]
      }
    },
    "overrides": [
      {
        "matcher": {
          "id": "byName",
          "options": "RawDataInWatts usage_watts"
        },
        "properties": [
          {
            "id": "unit",
            "value": "watt"
          }
        ]
      },
      {
        "matcher": {
          "id": "byName",
          "options": "RawDataInWattHours usage_wh"
        },
        "properties": [
          {
            "id": "unit",
            "value": "watth"
          }
        ]
      }
    ]
  },
  "pluginVersion": "12.0.2",
  "targets": [
    {
      "refId": "RawDataInWatts",
      "datasource": {
        "type": "questdb-questdb-datasource",
        "uid": "aeqknl0dxvny8a"
      },
      "queryType": "sql",
      "rawSql": "SELECT timestamp as time,  sum(usage_wh * 3600)/($__interval_ms/1000) usage_watts FROM \"utility_elec\" WHERE $__timeFilter(timestamp) SAMPLE BY $__sampleByInterval ALIGN TO CALENDAR",
      "builderOptions": {
        "mode": "trend",
        "fields": [],
        "limit": "",
        "timeField": "timestamp",
        "table": "utility_elec",
        "filters": [],
        "groupBy": [],
        "orderBy": [],
        "partitionBy": [],
        "metrics": [
          {
            "field": "usage_wh",
            "aggregation": "sum",
            "alias": "usage_wh"
          }
        ],
        "sampleByAlignTo": "CALENDAR"
      },
      "format": 0,
      "meta": {},
      "selectedFormat": 2
    },
    {
      "refId": "RawDataInWattHours",
      "datasource": {
        "type": "questdb-questdb-datasource",
        "uid": "aeqknl0dxvny8a"
      },
      "queryType": "sql",
      "rawSql": "SELECT timestamp as time,  sum(usage_wh) usage_wh FROM \"utility_elec\" WHERE $__timeFilter(timestamp) SAMPLE BY $__sampleByInterval ALIGN TO CALENDAR",
      "builderOptions": {
        "mode": "trend",
        "fields": [],
        "limit": "",
        "timeField": "timestamp",
        "table": "utility_elec",
        "filters": [],
        "groupBy": [],
        "orderBy": [],
        "partitionBy": [],
        "metrics": [
          {
            "field": "usage_wh",
            "aggregation": "sum",
            "alias": "usage_wh"
          }
        ],
        "sampleByAlignTo": "CALENDAR"
      },
      "format": 0,
      "meta": {},
      "selectedFormat": 2,
      "hide": false
    }
  ],
  "datasource": {
    "uid": "aeqknl0dxvny8a",
    "type": "questdb-questdb-datasource"
  },
  "options": {
    "tooltip": {
      "mode": "single",
      "sort": "none",
      "hideZeros": false
    },
    "legend": {
      "showLegend": true,
      "displayMode": "table",
      "placement": "right",
      "calcs": [
        "sum"
      ]
    }
  }
}
- Did you receive any errors in the Grafana UI or in related logs? If so, please tell us exactly what they were.
No errors
- Did you follow any online instructions? If so, what is the URL?
No, I tried a few searches but did not turn up anything super useful
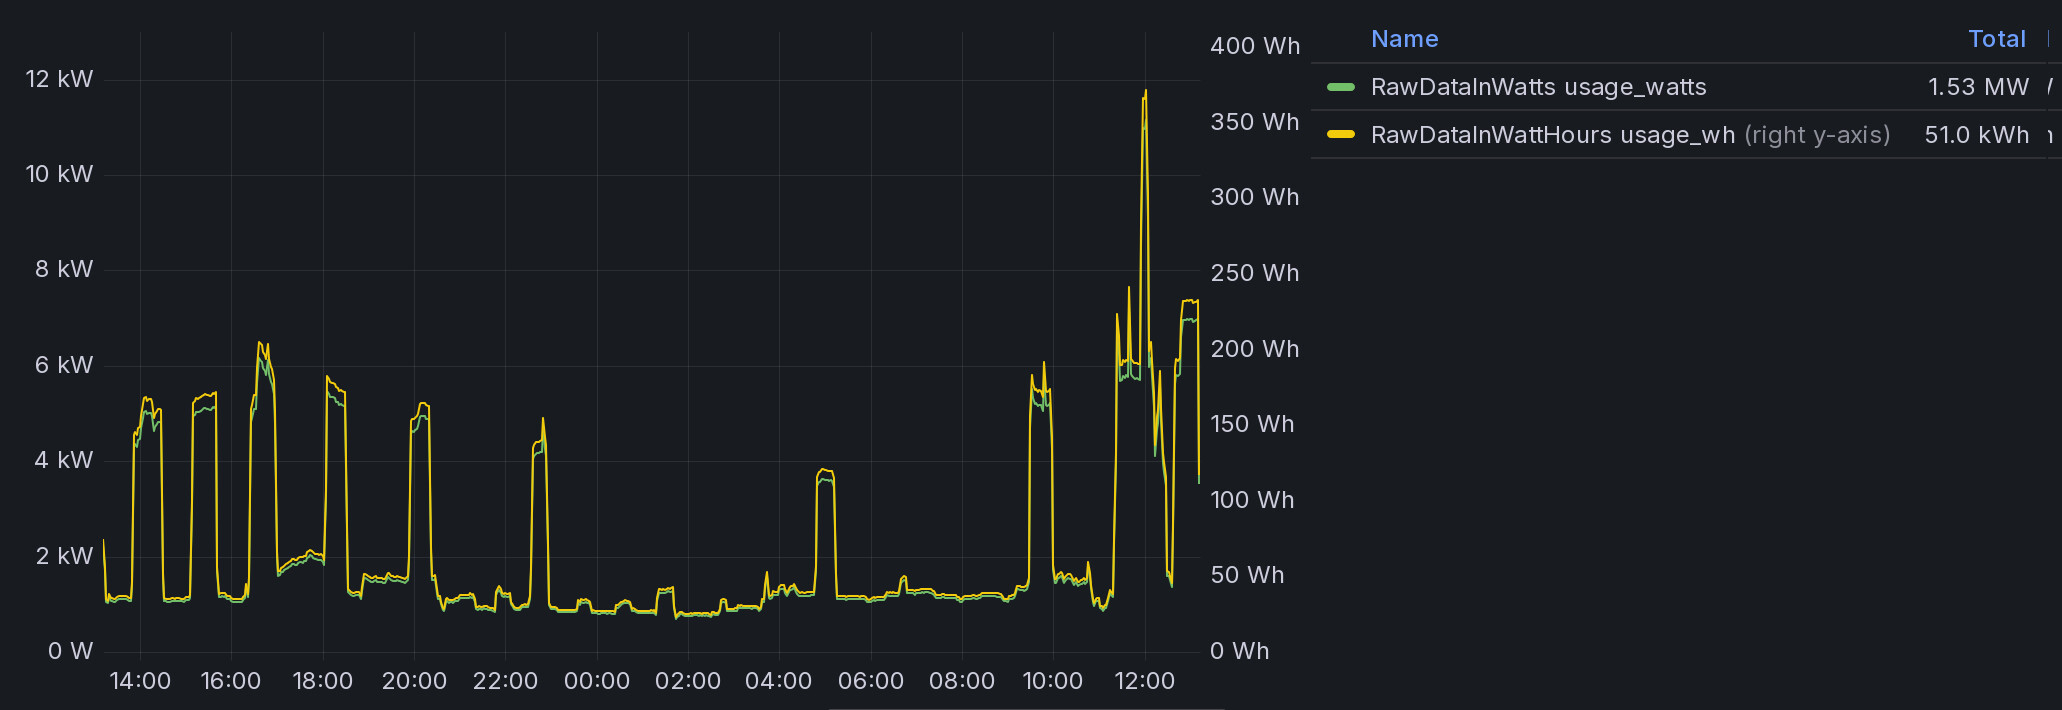
Screenshot shows a graph using raw data in both formats (watts, watt-hours). Ideally I want the axis+tooltip to show the watt values, while the total shows the kWh value.