Hello,
I installed Zabbix + Grafana in my environment last May and since that day till last saturday everything worked fine.
Last saturday the server was rebooted and then my grafana is not running anymore.
A point: if I start grafana with command below, it starts as expected but there is nothing inside, no dashboards, nothing.
“sudo /usr/sbin/grafana-server --config=/etc/grafana/grafana.ini --homepath=/usr/share/grafana”
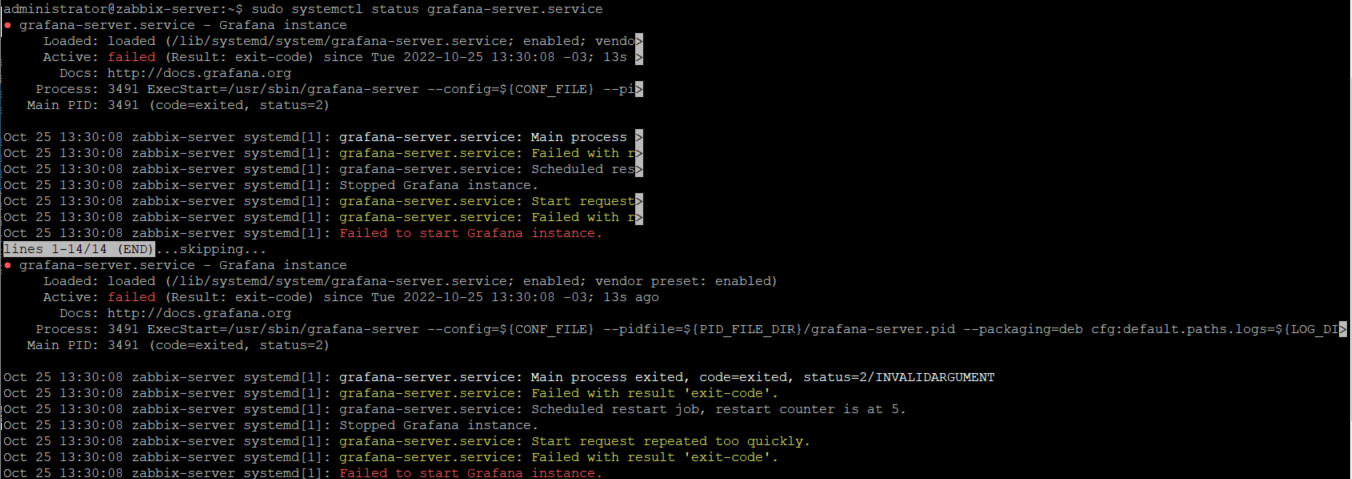
There are some images below that I think will help in troubleshooting.

Thanks in advance.