I have an issue with the Trace to Logs button in Tempo. The button shows disabled in my traces as shown below. I have the Trace to Logs datasource correctly configured as shown in the other image. And the Logs to Trace link in Loki is working fine. Any pointers on what disables this button ?


Hello 
For that button to be enabled you need to have the tags specified in your config in either your spans resource attributes or span attributes.
Trace
Config
If you do not, then the button will be disabled
Trace
Config
Now, if you do have the specified tag in either your spans resource or span attributes and the button is still disabled then that is a bug and it would be great if you could raise an issue in the Grafana repo!
It’s a bit confusing. Here my traceToLogs definition:

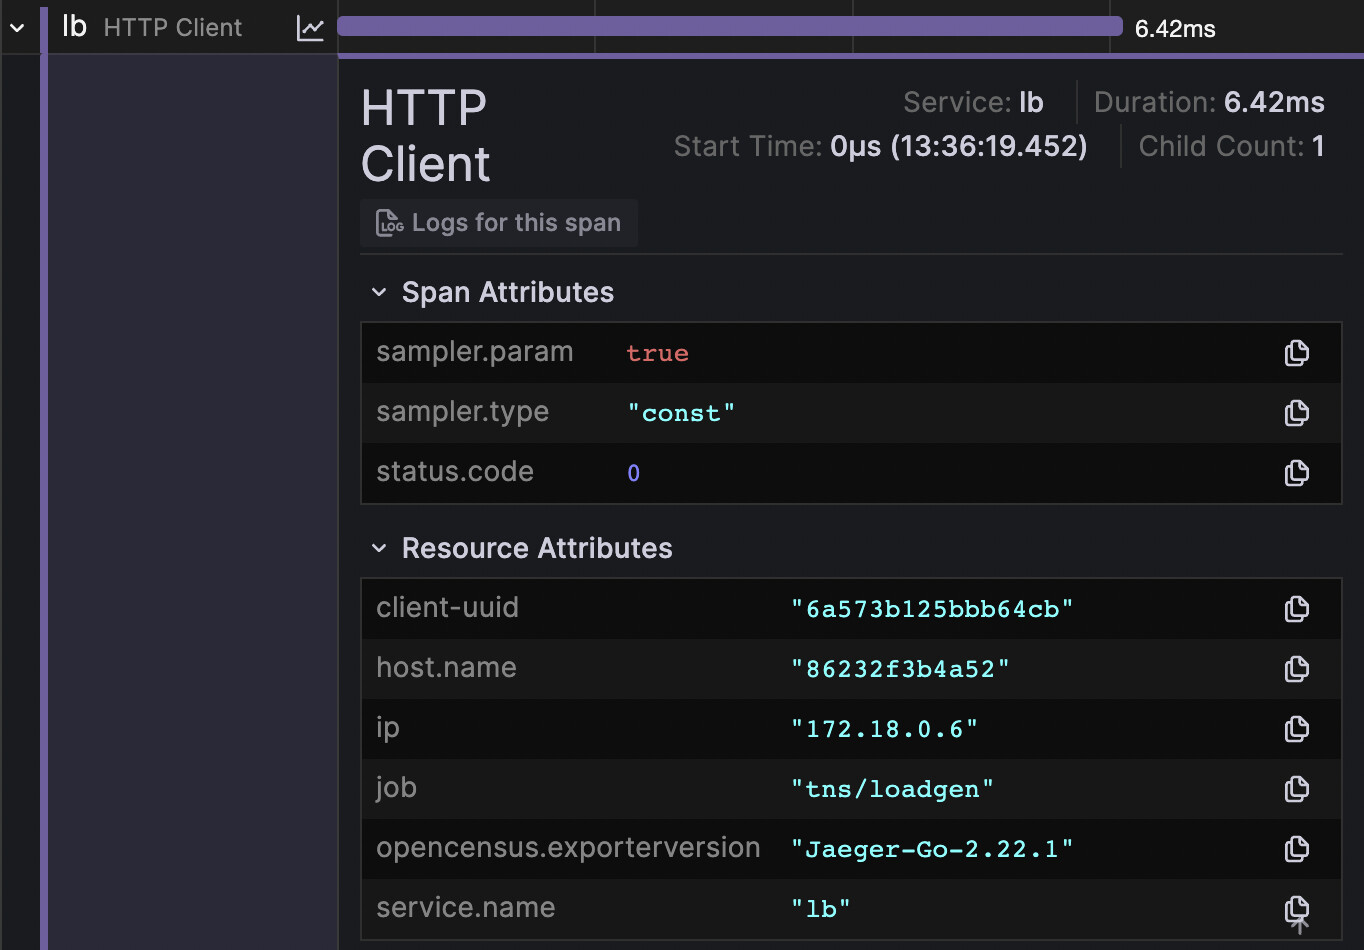
And here is the span with the service.name attribute in it. But the button is still disabled. I have tried using just one tag “service.name” or “job” with the same result.

If I had to take a guess, it would be that Loki changes “service.name” to “job” as it doesn’t allow dots in the names. But Tempo keeps using “service.name”. So perhaps they cant correlate. But that is just a conjecture.
Thanks for the update.
In this case, you would rename your service.name tag to job.
I am using data source definition for this tags configuration as I am running in docker. Can you please share what is the syntax to use for renaming the tags ? I could not find that in any documentation on this. The following setup allows me to add
service.name
as a tag but I dont know how to specify the “as” part.
tracesToLogs:
datasourceUid: loki
spanEndTimeShift: 30m
spanStartTimeShift: “-30m”
filterByTraceID: true
filterBySpanID: true
tags:
- service.name
Worked for me with the following settings:
datasourceUid: loki
spanEndTimeShift: 30m
spanStartTimeShift: “-30m”
filterByTraceID: true
filterBySpanID: true
tags: [{ key: ‘service.name’, value: ‘job’ }]