-
What Grafana version and what operating system are you using?
-
What are you trying to achieve?
I need to create a time series graph showing the incident durations from open to close of all tickets within a specified time frame I.E This week so far. -
How are you trying to achieve it?
As i’m capturing incidents within a ticketing system (Helix ITSM which uses Grafana dashboards for reporting) The amount of tickets will be dynamic. So i’m unable to create a query per item. There might be 10 incidents in a week, or 30. -
What happened?
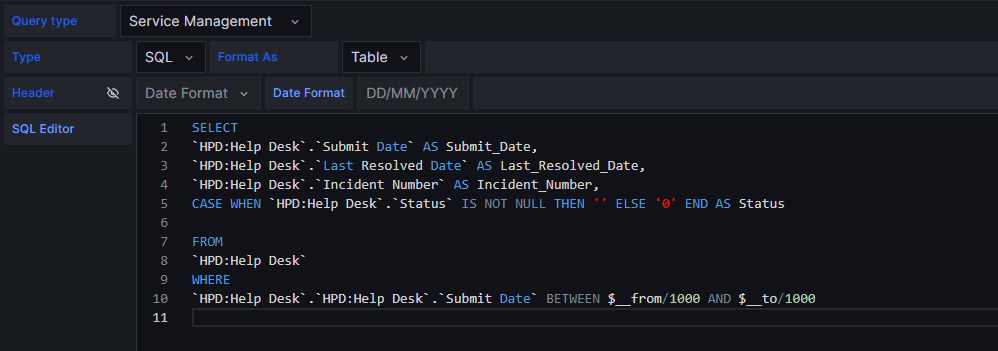
I’m able to create the graph using ‘Partition by values’ transformation but it only pulls the first date column it sees, in this case submit date., I have no clue how to include a 2nd date column (Resolved date) in order to provide a duration for this graph rather than have all tickets go on forever with no end date as shown currently in the graph i have. -
Can you copy/paste the configuration(s) that you are having problems with?

-
Did you receive any errors in the Grafana UI or in related logs? If so, please tell us exactly what they were.
-
Did you follow any online instructions? If so, what is the URL? No, i’ve only found solutions where people create multiple queries but my metric or (Incidents) is not static , its dynamic so cannot be defined.