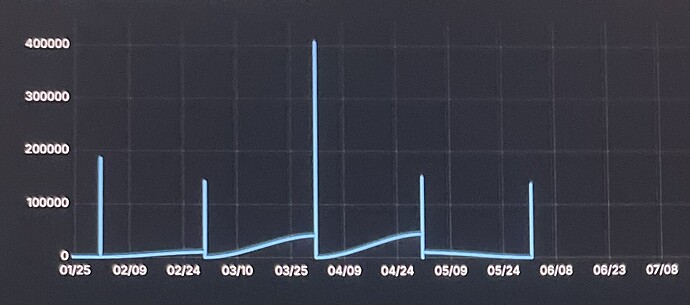
HI!
I can’t chart multiple time series using PostgreSQL:
Query:
SELECT
DATE_TRUNC(‘month’, CDate) as month,
DocumentTypeName,
count() as “Amount”
FROM table
GROUP BY DATE_TRUNC(‘month’, CDate), DocumentTypeName
ORDER BY month
Grafana builds dashboard correctly only with specified DocumentTypeName with condition WHERE. I don’t want to add many queries but visualize in one query.
Similar problem was solved in Grafana: How to chart multiple time series from a single SQL query? , but the solution qoesn’t work in my case.
try
SELECT
DATE_TRUNC(‘month’, CDate) as month,
DocumentTypeName as metric,
count() as value
FROM table
GROUP BY DATE_TRUNC(‘month’, CDate), DocumentTypeName
ORDER BY month
and make sure timeseries is selected for Format
Can’t find the bottom for time series/ table format.
Can u give an advice where is it, please?
maybe clickhouse does not have it

did you try that query? and what result does it give you
SELECT
DATE_TRUNC('month', CDate) as month,
DocumentTypeName as metric,
count() as value
FROM table
GROUP BY DATE_TRUNC('month', CDate), DocumentTypeName
ORDER BY month
Yes, I tried. The same result. My query was similar.
sure, you have selected “Time series” as Format?
Are you able to show us the raw “Table view”?
or try “Partition by values” as transformation.
Jo
1 Like
Thanks! I used ‘partition by values’ in Transformation, now it works.


