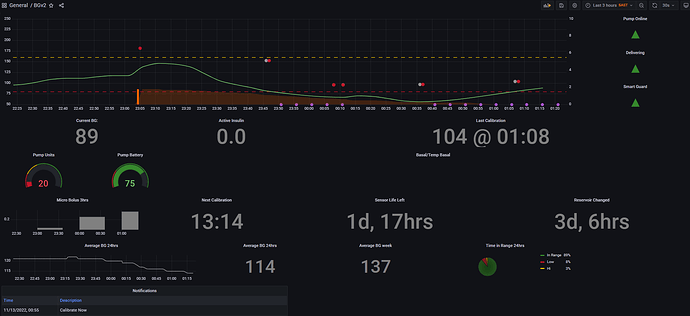
Running Grafana on Windows 10 v9.2.2 & Ubuntu v9.2.3 both with SQLite data source. Both experience the same issue.
I am trying to get Grafana to not modify the time returned in a query based off of UTC or other time zone.
Background: My daughter is a Type 1 Diabetic. The data is stored on her insulin pump based off the time on the pump. I pull that data from her pump manufacturer’s api and all times in that data set is to her pump time, not a time zone. So when we travel and update her pump time, which happens often, I have to go into Grafana update all my queries to update the time off-set that the graphs shows when something happened at the right time.
What I am trying to achieve is to set the time zone (that she currently is physically in [which her pump time is manually set to]) on the dashboard and the dashboard shows the last 3 hours of data without having to go into all the each one of my panels and update them to account for any time offset.
What is happening is that every time she updates her pump time I have to update the dashboard in about 20 places. I have to update the following: date(DateTime,‘-2 hours’) || ‘T’ || time(DateTime,‘-2 hours’) || '.000Z which what I am trying to move away from.
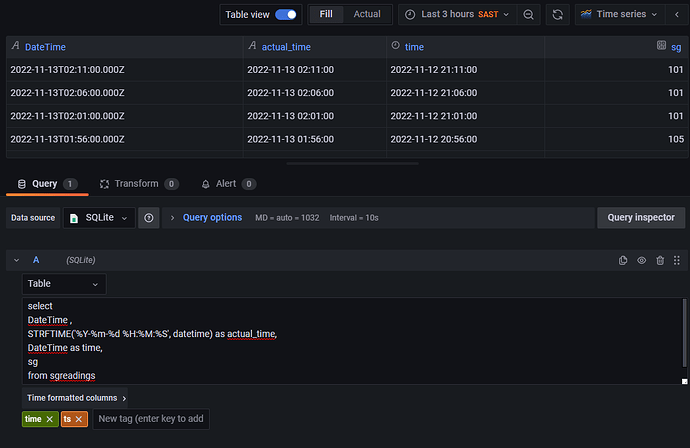
I would like to use the query below without having to add the time zone offset and the data that returns on line 1 @ 2:11AM displays at 2:11AM on the time series graph. I have tried matching the format that the formatted columns transforms them into: see code for actual_time, but when I do, the time series indicates that there is no data to graph.
Is there a way to use Grafana in such a way that it doesn’t modify the data when you query it, see the differences between the results returned, column 1 contains the date & time that columns 2 or 3 should display.’
Any assistance would be greatly appreciated!
Try to set UTC timezone for your dashboard (because Grafana assume that data are stored in the UTC timezone and “move” them to your local browser timezone atm). Data in the DB should be saved in UTC timezone as well to avoid any issues with timezone.
1 Like
Thank you for your reply. As the data comes to me without regard to a time zone, I would have to do the same thing and update time shifts everywhere and that brings me back to my original point. I would like to know how to get Grafana to just display the time as is without being ‘smart’ and adjusting it for me.
I post it already: set UTC timezone for your dashboard
As jangaraj said, you can set the timezone on that specific dashboard to UTC time.
I didnt want to do this because it is confusing to see UTC when selecting timezone.
For me, I am using SQL query. I am using a timestamp column but the server time is set to CST. This is not something I can change and we will be changing this in the future after dealing with all the issues that will come from it.
So in my case what I do is on the date fields in the query I use:
select
sometable.somedatefield + interval 6 hour
from sometable
I then go into my dashboard settings it set my timezone to el_salvador (because that is what I am using)
Now even though I am in EST US time zone I am picking the time for el salvador in the dashboard and seeing the dates correct when I group by date.
@tonyramin, my suggestion is to set the timezone to UTC like tonyramin said. Option 2 would be since you obviously wrote a script to save to the database from the API, would be to find the pace maker time offset to UTC time, in the script add or subtract that time to a new column “datetime_utc” or some name you want. Then you can back fill this field with a query. That would mean you can see the information related to your current timezone while travelling but also can have a different dashboard set to UTC time based on the pacemaker time itself.

