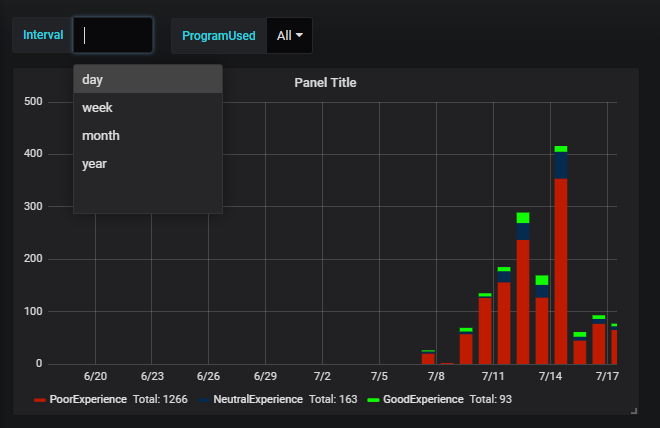
Hello,
Is there a way I can change the text that is displayed in the horizontal axis for a time series?
- I am not talking about a series’ text label.
- Also not talking about choosing a time range and configuring the query with it.
I have data for a period of six months, and I would like to set the time axis (XX) ticks to be weeks, independently of how big or small my time range is.
Is such a thing possible without editing the Grafana source code?
Thank you very much for your help.
Hi mcoimbra
use the variables like

and 
this way may helpful
Regards
Siva Prasad
Hello Siva Prasad,
What you suggest only changes the granularity of the data.
I already have a variable to group by hour, 30 minutes or a week if I want.
What I would like is to change the horizontal axis labels to show for example weeks:
Jun Week 4
Jun Week 5
Jul Week 1
Jul Week 2
Jul Week 3
Is such a thing possible without editing the source code of Grafana?
Is it a supported feature?
If not, has it been submitted as a feature request?
Thank you very much.
Hi mcoimbra
as of mine ,That thing is only possible with changing the source code .
Regards
Siva
No, there is no way to configure the datetime format of the X-axis in the Graph panel at the moment.
1 Like

