Hi @starfoxfs,
Bars are not proportional because y-axis starts from 8.6 kWh instead of 0 kWh. You can change that y axis starts from 0 by setting Min = 0 (under Standard options).

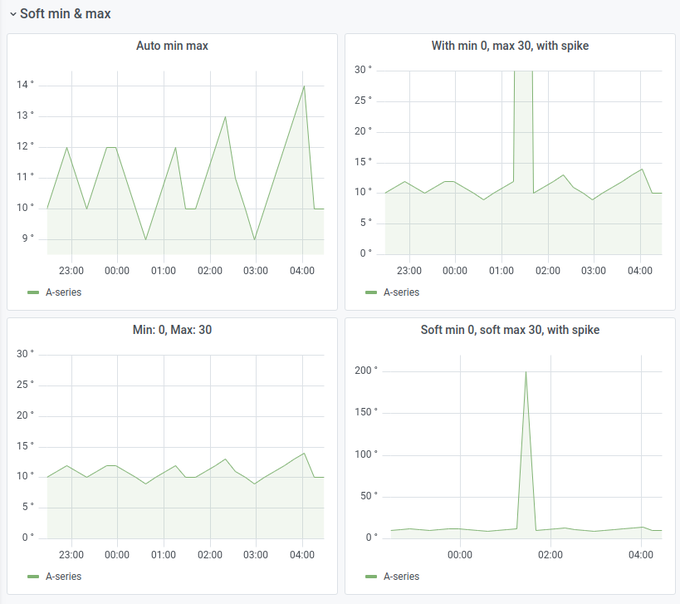
Another option is to define Soft min = 0 (under Overrides) which will do the same. Key difference is that soft boundaries can be exceeded while true boundaries (Min/Max) can’t. So, if you use boundary Min = 0 and have negative values of power (just an example) those won’t be shown on graph while if you use Soft Min = 0 then you would see those values on graph as well. In your case you can use either one because you can only get power from Solar panels ![]() ( well, untill short circuit
( well, untill short circuit ![]()
![]() ) .
) .

Here is explanation between Max and Soft Max:
Best regards,
ldrascic