We have a simple bar chart that shows the uptime of devices, thresholds set accordingly and everything works fine - until the variable is changed to select a different group of devices and then the threshold colours go a bit weird…
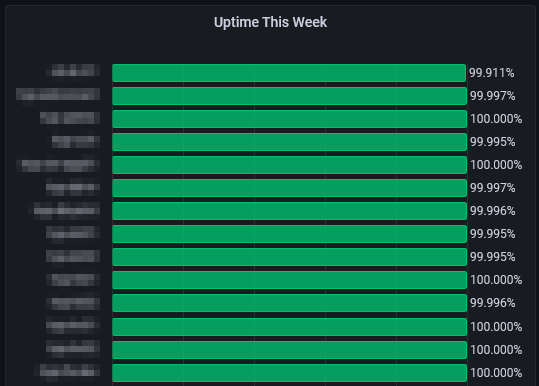
In the screenshot below is what i see when choosing a new group of devices, the chart updates and i see the device names with their correct uptime values (but wrong colours, everything is green):
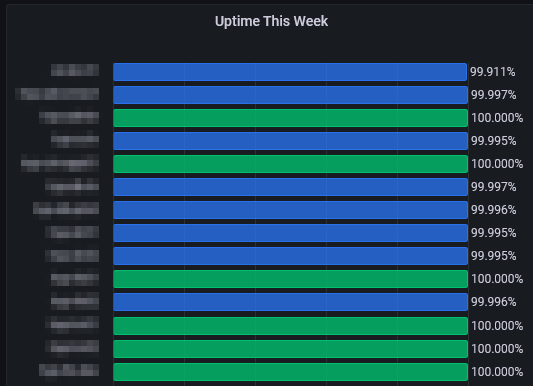
When i refresh the page (not the data) the colours sort themselves out and are matched to a threshold value:
I’ve tried this in Firefox and Edge with the same results, could it be a bug? (using version 8.4.4)