I created a Stat Panel where I monitore the last “Date modified” time. I get a unix timestamp from my zabbix Agent and scale it with 1000 in Grafana.
Then I use the Unit “From Now” to see, when the file was updated the last time.
I tried now to create a Threshold to put the panel to red, when the file is older than 30 hours.
Hi @grafanajul,
Maybe you can do this with simple thresholds? I set up different thresholds for Measurement1 and Measurement2 and I have done that by using Overrides (and the select Field with name).
thank you for the reply!
I already tried this but I dont know how I should use the threshold…
Since I receive a unix Timestamp and scale it with 1000 to get the Seconds and then I convert it to hours since last update.
It doesnt work, even I use hours or unix timestamps.
In the screenshot you can see, that the update is older than 20 hours, if I now use a threshold for 15, 20 and 25, it doesnt work.
It should be displayed orange but its red…
Hi @grafanajul,
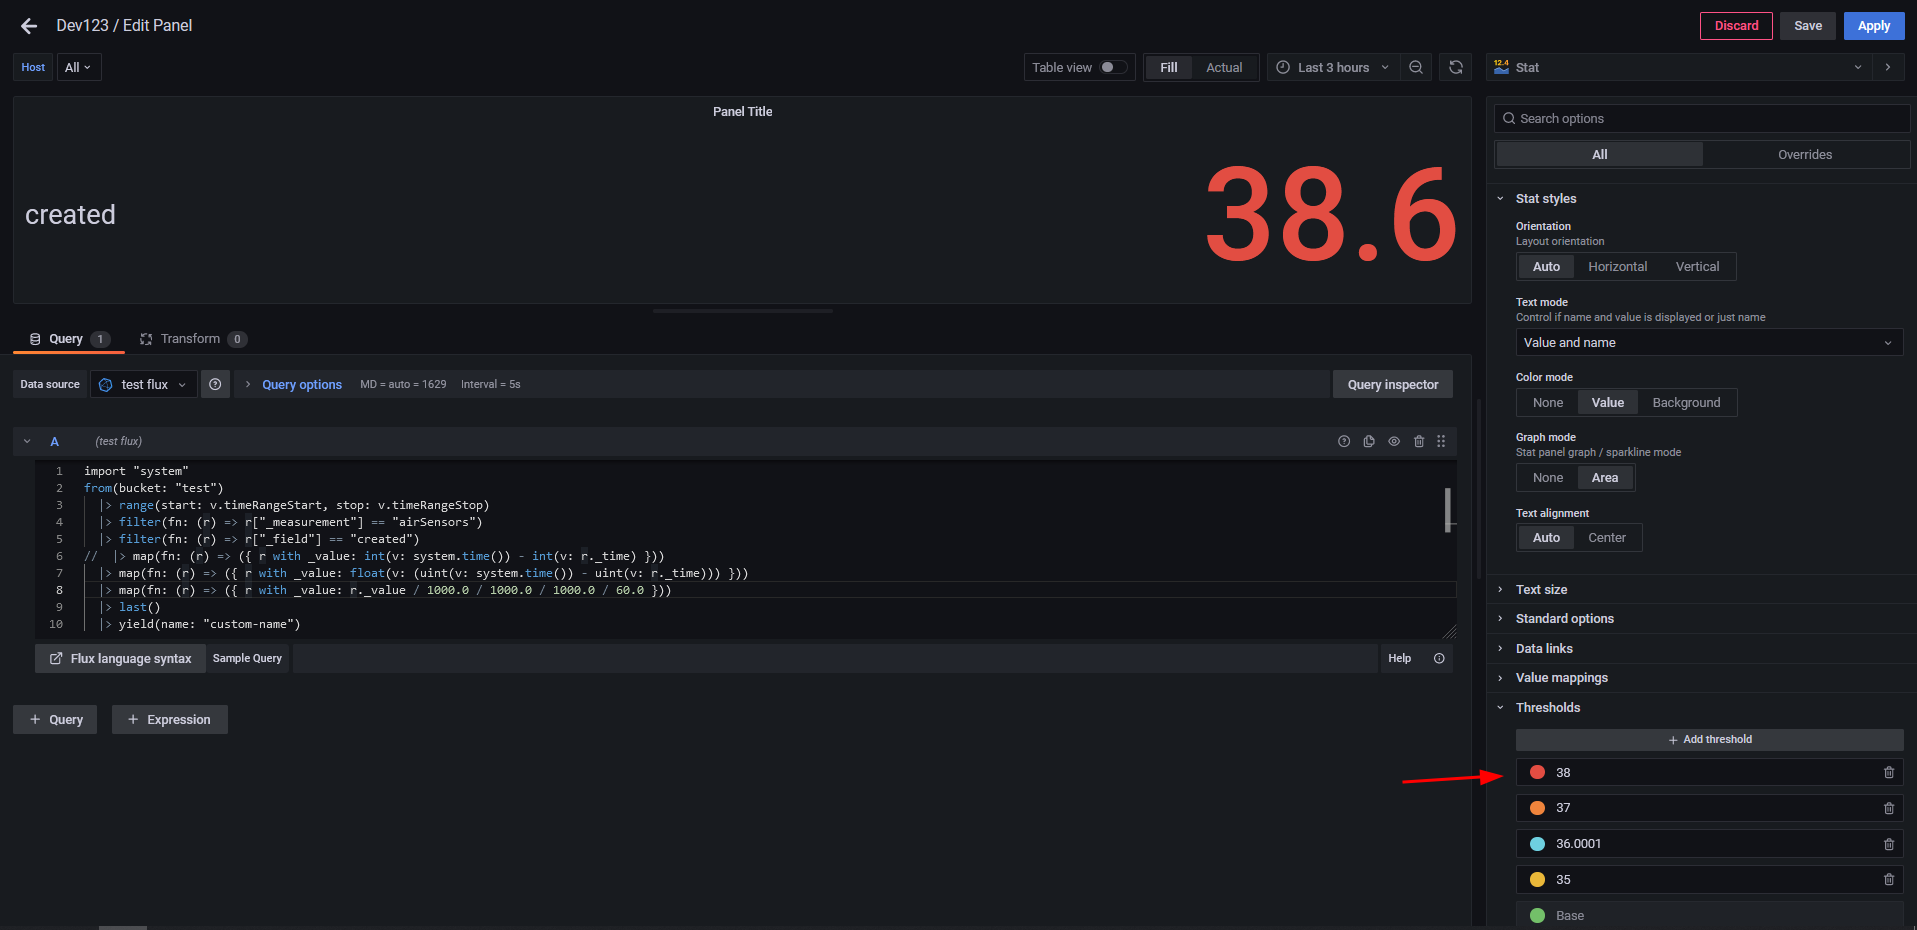
I don’t have Zabbix data source but I managed to do it with Influx DB 2.6.1. (Flux language) so I am posting this here in case somebody else would be interested in that.
The reason why setting Unit to From Time and setting thresholds in hours (e.g. 25) doesn’t work is that the raw value in background is still the same (large unix epoch time number e.g. 1675364521000000000).
The key part is that you need to subtract time when metric arrived from current time ( current_time - time_of_metric_arrival ) and convert values to something meaningful like minutes or hours. Then you can define thresholds in same unit as raw data that shows in panel (e.g. if you normalize query to show in minutes your thresholds must be in minutes). For aesthetic reasons you can set Standard options -> Unit to minutes so that panel shows converted units (eg. instead of 65 min it will show 1.08 hours). Note: Setting unit only affects how value will be interpreted on panel but raw data is same.
import "system"
from(bucket: "test")
  |> range(start: v.timeRangeStart, stop: v.timeRangeStop)
  |> filter(fn: (r) => r["_measurement"] == "airSensors")
  |> filter(fn: (r) => r["_field"] == "created")
  |> map(fn: (r) => ({ r with _value: float(v: (uint(v: system.time()) - uint(v: r._time))) })) // subtract time of metric arrival (r._time) and current time (system.time())
  |> map(fn: (r) => ({ r with _value: r._value / 1000.0 / 1000.0 / 1000.0 / 60.0 })) // convert unix epoch time in nano seconds to minutes
  |> last()
  |> yield(name: "custom-name")
I used uint() function to convert timestamp into unsigned integer which is epoch time in this case but after subtracting I converted value to float() so that in next step I can use division in order to get result in minutes.
Hello, I changed the java script in Zabbix now.
Now I could use the threshold to change the colors. I would like to use the value mapping or the stat panel but it doesnt work.
In my screenshot you can see that I receive a value of “75060” and I created a value mapping for “70000” to change the color to red and display “not ok” but It doesnt work…
Threshold would work.