-
What Grafana version and what operating system are you using?
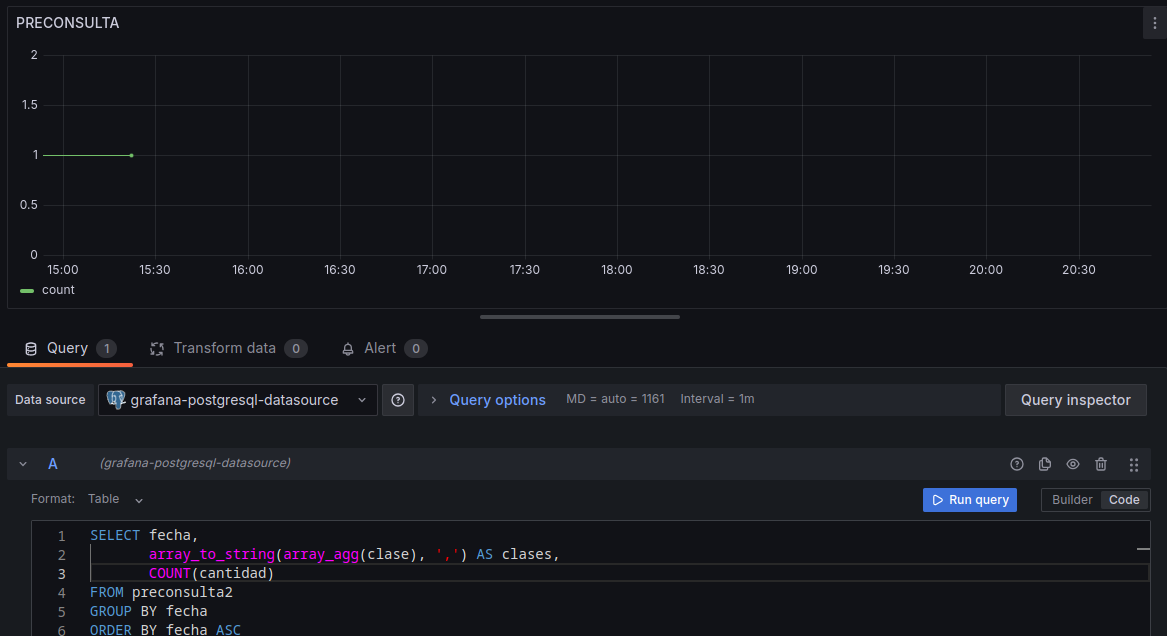
Grafana v10.4.1 in docker -
What are you trying to achieve?
I need the classes to be displayed on my dashboard -
How are you trying to achieve it?
through this query :
SELECT fecha,
array_to_string(array_agg(clase), ‘,’) AS clases,
COUNT(cantidad) AS cantidad_total
FROM preconsulta2
GROUP BY fecha
ORDER BY fecha ASC -
What happened?
It only brings me the result of the count -
What did you expect to happen?
the classes to be displayed on my dashboard -
Can you copy/paste the configuration(s) that you are having problems with?
-
Did you receive any errors in the Grafana UI or in related logs? If so, please tell us exactly what they were.
NO -
Did you follow any online instructions? If so, what is the URL?
NO
Which column is date time?
SELECT fecha as time,
array_to_string(array_agg(clase), ‘,’) AS metric,
COUNT(cantidad) AS value
FROM preconsulta2
GROUP BY fecha
ORDER BY fecha ASC
The fecha column is the one that has time and date in timestamp (postgres) in the following format: YYYY-MM-DD HH:MM:SS.SSS
then try this
SELECT fecha as time,
       array_to_string(array_agg(clase), ',') AS metric,
       COUNT(cantidad) AS value
  FROM preconsulta2
 GROUP BY fecha
 ORDER BY fecha ASC


Works! thank you
