Table Panel Showing Single Row

  • What Grafana version and what operating system are you using?
    Grafana: 7.5.10
    OS: Ubuntu 20.04.3 LTS

  • What are you trying to achieve?
    Create a table dashboard that displays all rows and not just one

  • How are you trying to achieve it?
    Using ‘Outer Join’ by instance and organize fields

  • What happened?
    the queries are showing data, but the table only shows a single row

  • What did you expect to happen?
    to show all rows

  • Did you receive any errors in the Grafana UI or in related logs? If so, please tell us exactly what they were.
    no

Apologies if this has already been addressed, I searched for similar issues and could not seem to find one.

I’m trying to create a table with multiple queries

I added the queries, formated as table, instant selected

In transform I select “Outer Join, instance” and use organize fields to relabel the organize the columns

I can inspect each query and see the data is there, it’s just not displaying everything in the table, only a single row

I’ve made similar tables before, not sure why this one is not working.
Is there something I’m missing?

The reason it is showing a single row is because of the choice of Field Name choice.

If each query only has only a single field it will simply join as you are seeing as do the same as a merge.

At the moment each query appears to be returning a single cell and not a row of table data.

Thanks for the input.

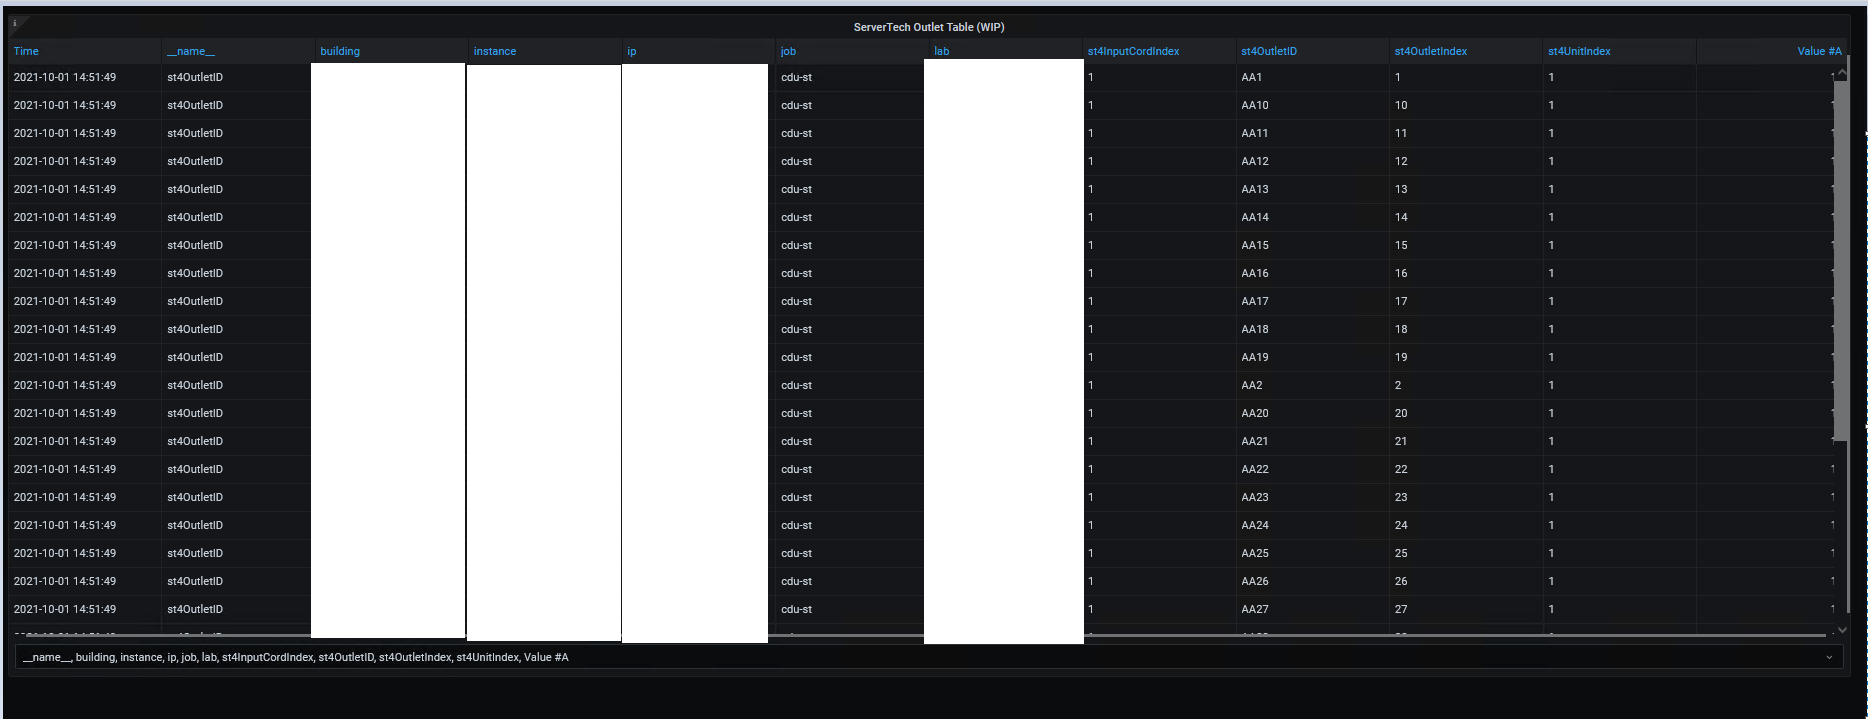
I removed all the transformations just to be certain all the queries are returning a table and not a single field.

When I do, the dashboard shows a drop down menu at the bottom, where I can select and view each query separately. Viewing each one, I can confirm they all return a table, each with 30 rows

Selecting Outer Join → Instance it converts to a single row

It would be helpful to provide a screenshot of any 2 queries and also you have not indicated what field you chose to do the join with?

Oh I see from your screenshots you are joining on instance

Could you provide a screenshot for any two raw queries?

Also, I note that in the final table you hide the instance column?

Show with all columns raw?

Provided screen shots with 2 queries, with no transformations at all, I can see they all return a table of values

A = st4OutletID{instance=“$CDU”, st4UnitIndex=“1”}
B = st4OutletName{instance=“$CDU”, st4UnitIndex=“1”}


Yes, I was joining by instance, I thought I mentioned it, maybe I didn’t made it clear.
The instance column was hidden as I do not want it displayed on the table.
Does hiding it actually remove it from the results? I wouldn’t expect that.

Thanks

From the query, I see INSTANCE is $CDU in both queries but I am unable to see what value it actually is

But I see that in either query the times in each query are all the same but different in each query. If you join by time you should get rows as I see it but I do not have data to play around with.

When you do a join without any other transformation what do you get?

Have you tried using stdOutletindex as the join field?

The join field in each query should be identical in each row of each query but each row should be different.

Are you trying to produce a single table with all rows from each query or a single table with 30 rows but all columns from each query?

$CDU is a variable for the dashboard, label_values(instance)

That was it! It seems joining by instance was not what I needed.

Since ‘instance’ is the same for each time series/table returned, but the st4OutletIndex was unique to each series?

Thank you for the help

All’s well that ends well :+1:

This topic was automatically closed after 365 days. New replies are no longer allowed.