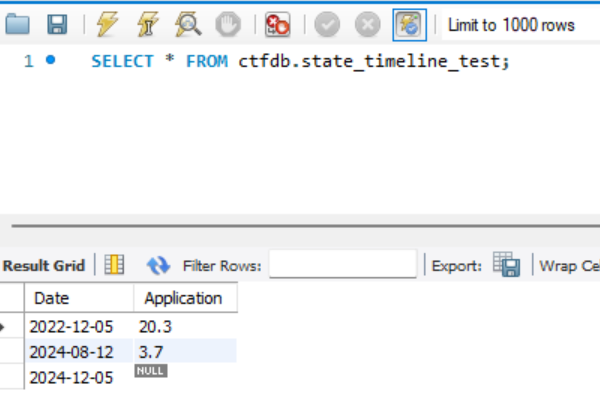
I am trying to create a state timeline chart using a MySQL table as the data source, but having issues getting the visualization to render in Grafana. I constructed a two-column table in MySQL that aims to visualize two distinct timeframes for an application on a chart. I am specifying the Date as the time field in the transformation editor, but it is not accurately depicting the two timeframes I want to capture visually.
Below is the state timeline screen that is currently rendering via MySQL, along with the screenshot of the MySQL table, and the desired visual currently generated via the Infinity Plugin:
Current screen:
MySQL table to use as a data source:

Desired Grafana screen:
I feel that there must be something minor that I must be missing with the data transformation, or through specifying MySQL as a data source. Any assistance is most appreciated!

