Hi,
I do have a mySL/MariDB query giving me several lines with time, a value and the name of the line.
here: Multiple lines in one graph with only one query
I found, that I have to name them time, metric and value to get several lines.
But it does simply not work. They all are mixed together as if the metrics coloum is not present.
Can someone help me please out, what I am missing.
This is my querry:
SELECT
(UNIX_TIMESTAMP(timeinfo)) AS time,
name as metric,
w as value
FROM table1
WHERE
name in (“data1” ,“data2”, “data3” )
and
$__timeFilter(timeinfo)
ORDER BY timeinfo
If I enable “table view” i get this result:
time, metric, value
03.01.2023 19:21:03, data1, 32
03.01.2023 19:21:03, data2, 58
03.01.2023 19:21:03, data3, 33.4
03.01.2023 19:23:03, data1, 30.6
03.01.2023 19:23:03, data2, 1.6
03.01.2023 19:23:03, data3, 9.6
03.01.2023 19:27:08, data1, 58
03.01.2023 19:27:08, data2, 18.3
03.01.2023 19:27:08, data3, 48
Version: * [v9.3.2 (21c1d14e91)]
Could you please show a screen shot of “does not work” means?
Also please post the data type of timestamp
The datatype of the SQL database is DATETIME.
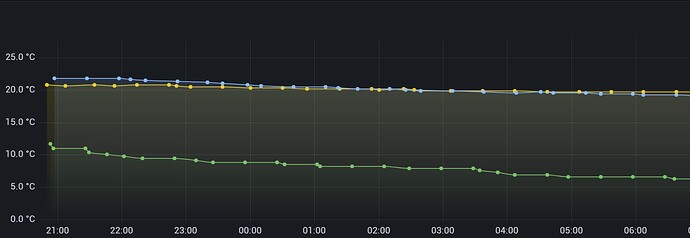
Does not work means, all data are comined into one row, but in the example I would need 3 rows (one for data1, one for data2 and a third for data3)
This (it is from another dashboard, with different data source and 3 independent tables) is wat i want to have in a single query:
1 Like
SELECT  logdatetime as time, [data1], [data2], [data3]
FROM
(
  select logdatetime, value, metric from mishmash
) AS TableToPivot
PIVOT
(
  SUM(value)
  FOR [metric] IN ( [data1], [data2], [data3])
) AS pv;
Looks interresting, an honestly, I do not understand how it should work. It would be nice if you could explain it to me, maybe I will get it when I know how.
Do you know where the problem is with my solution?
I tried it anyway and have this result
b query error: Error 1064: You have an error in your SQL syntax; check the manual that corresponds to your MariaDB server version for the right syntax to use near ‘PIVOT ( SUM(value) FOR [metric] in (“data1” ,"data2…’ at line 15
you are welcome.
in another post you said
“Our data is stored in a MS SQL database in long format, like (only an example):”
The above query is for MS SQL . For MariaDB you might want to go to a Mariadb forum
I’m sorry, the other post only told me the same problem. I did not focus on the SQL version in this other post.
There, to solution looks so simple.
I do have MySQL/MariaDB
But related to Grafana, do I understand right, that I can not use this result with 3 coloums to get 3 lines?:
time, metric, value
03.01.2023 19:21:03, data1, 32
03.01.2023 19:21:03, data2, 58
03.01.2023 19:21:03, data3, 33.4
03.01.2023 19:23:03, data1, 30.6
03.01.2023 19:23:03, data2, 1.6
03.01.2023 19:23:03, data3, 9.6
03.01.2023 19:27:08, data1, 58
03.01.2023 19:27:08, data2, 18.3
03.01.2023 19:27:08, data3, 48


