What Grafana version and what operating system are you using?
I am using v10.2.0 under Docker Desktop (Macbook Pro - M2).
What are you trying to achieve?
Ultimately I am trying to display the RX bitrate of a switch’s interfaces under one visualisation in the correct order (ports 1-30). The data is being queried from Prometheus/SNMP Exporter.
What happened?
The interfaces were displayed in alphabetical order by the ifName label rather than the index’s numerical order.
For example:
0/1, 0/10, 0/11 …
instead of:
0/1, 0/2, 0/3 …
See below:

What did you expect to happen?
I would like the interfaces to be displayed in the correct numerical order.
How are you trying to achieve it?
Here is the Prometheus query I have been using:

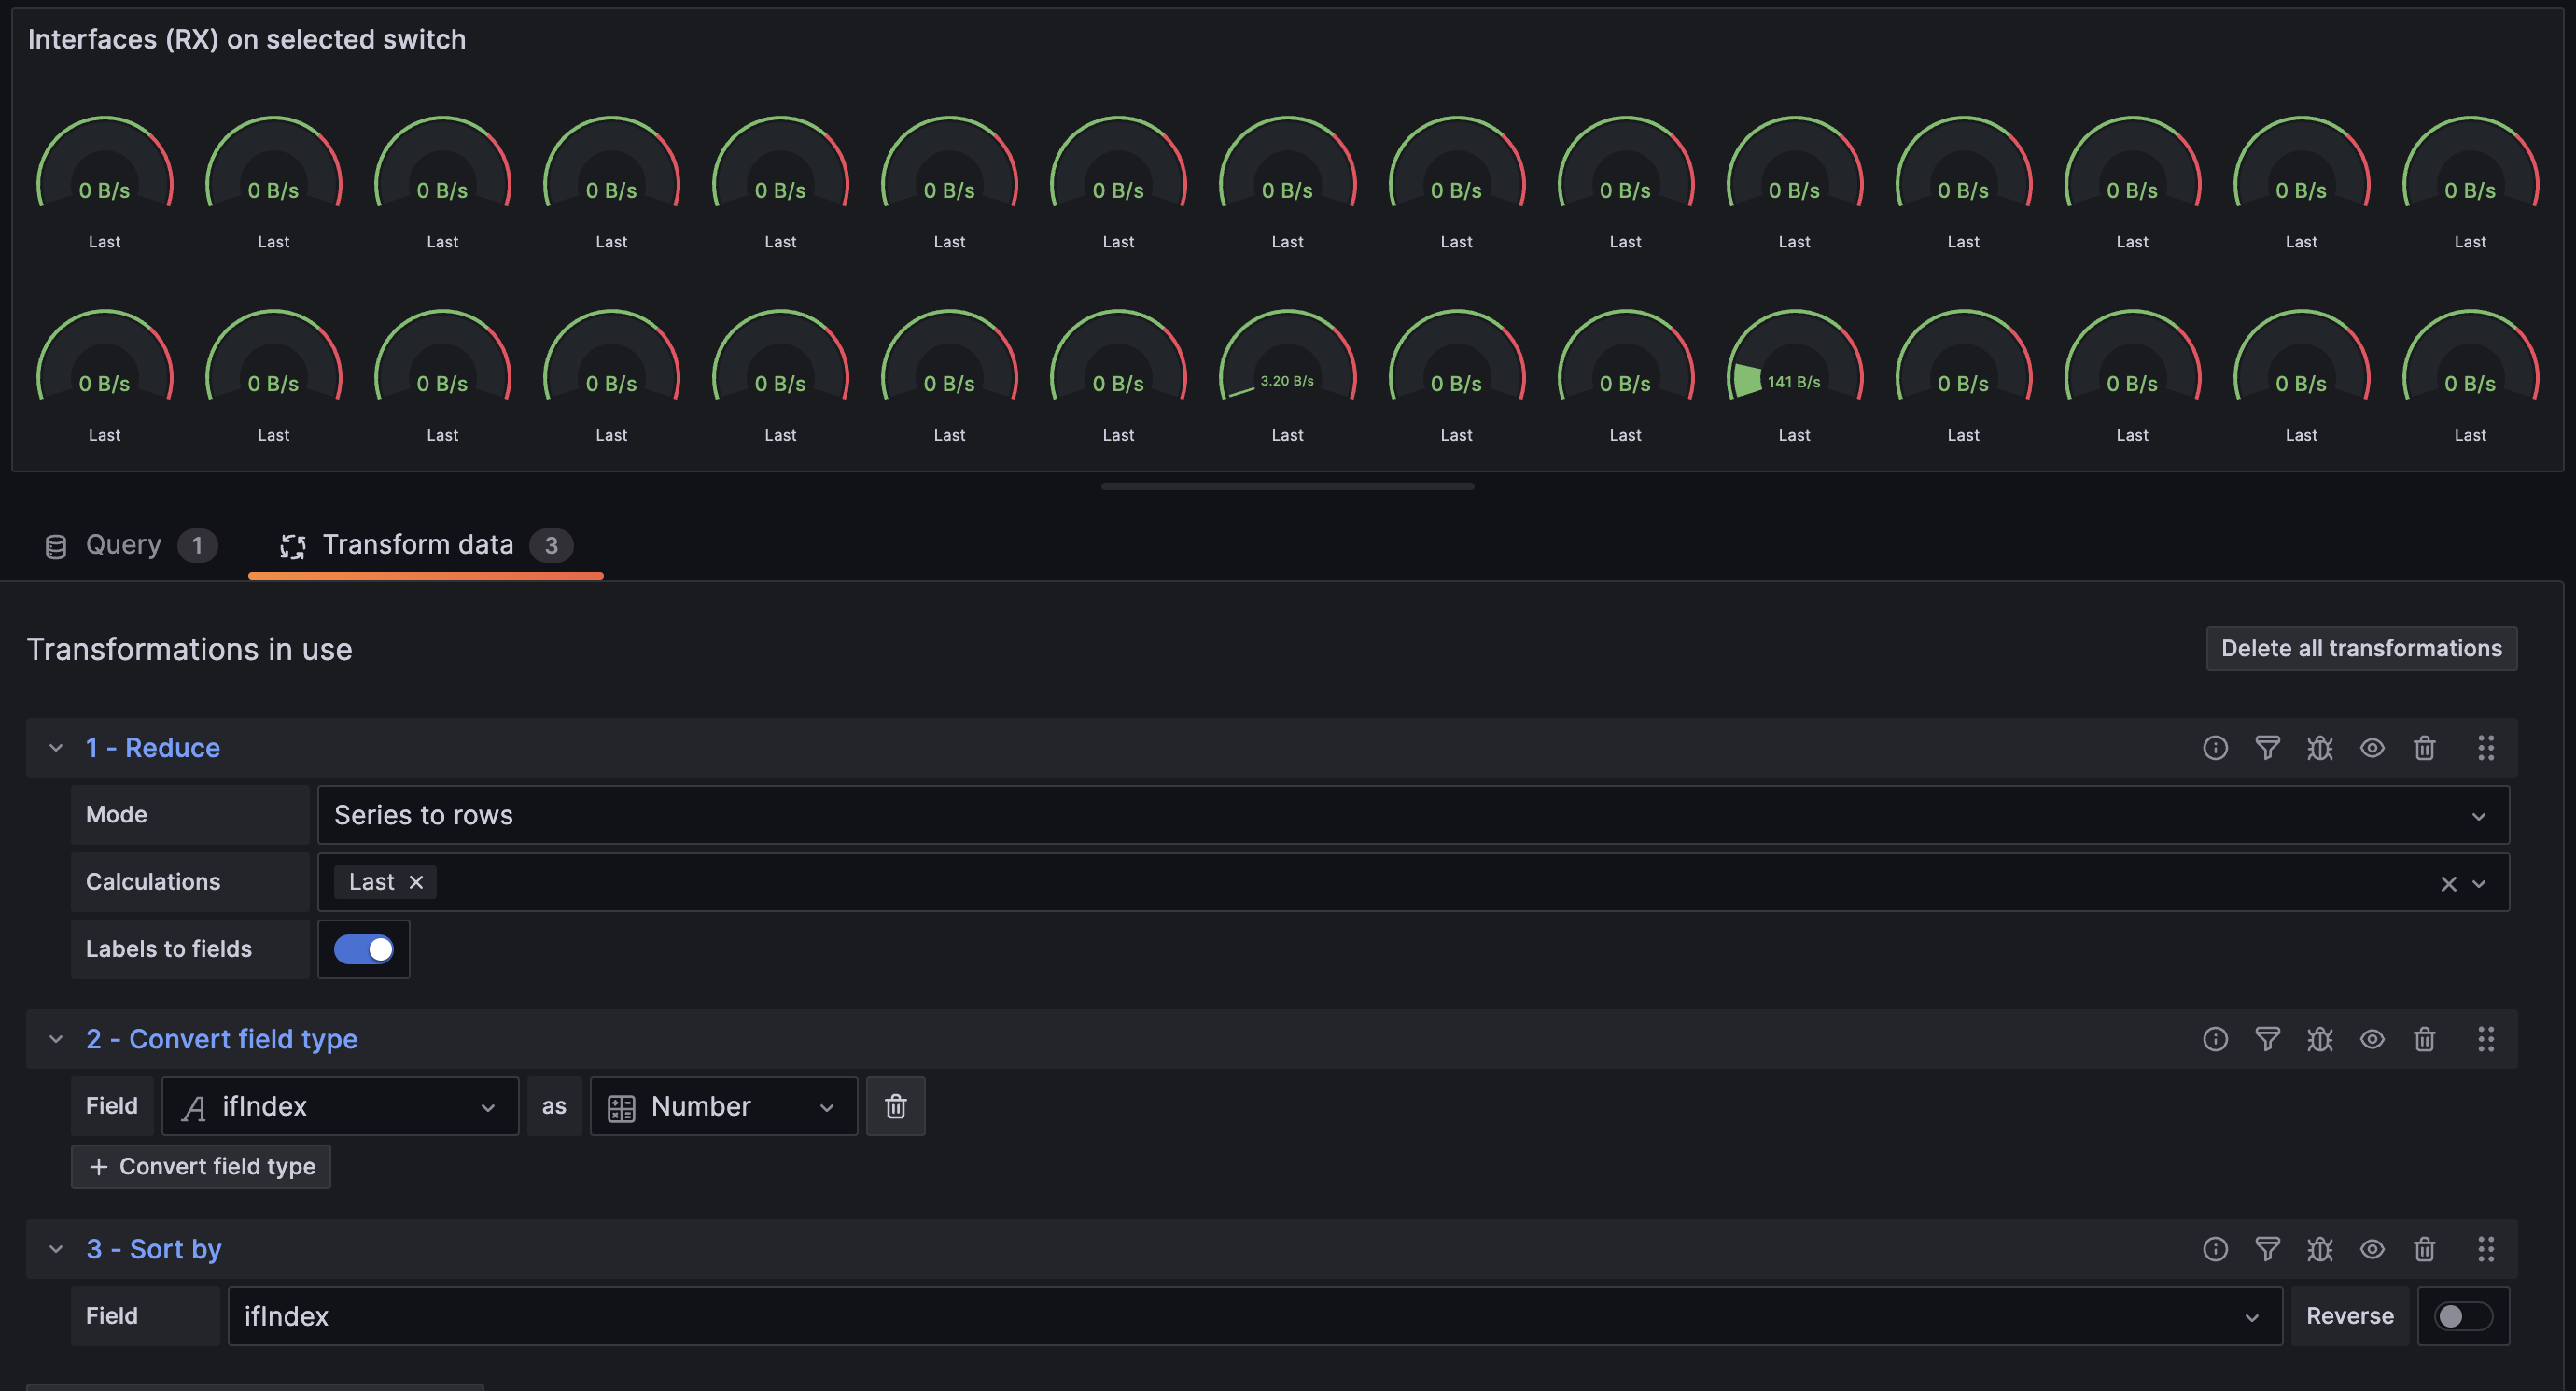
My attempt to workaround the issue has been by transforming the data and then sorting by the ifIndex label. This appears to work, but I then can’t manage to display the correct label beneath the guage.
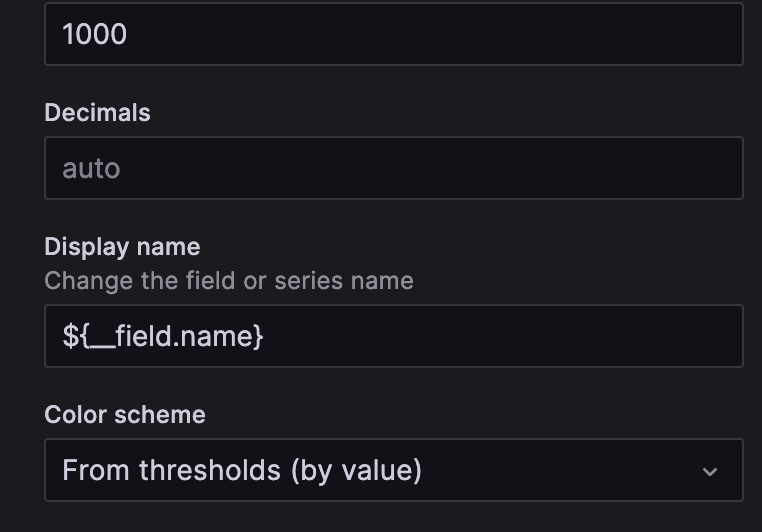
I would like to access another field’s value, but I can’t find a way to achieve this; I can only access the field’s name (which in this case, after the ‘Reduce’ transform, is ‘Last’):

Any help would be greatly appreciated. Thank you.