What is the chore?:
Slack alerts do not include image
Is there anything else we need to know?:
I have Grafana 9.5.1
However, the alerts still do not include images.
The attached images are my settings


What should i do ?
anyone could help me ?
Thanks in advance
~ the grafana team
Hi! Do you know if you using an incoming webhook or a bot token? If you are using an incoming webhook, you need to use a bot token instead because incoming webhooks do not have permissions to use Slack’s files.upload API. There is some information about this in the table here.
Hi George,
Thanks for your reply!
I am using a token as follows
is that right?
Hi! That look’s correct! 
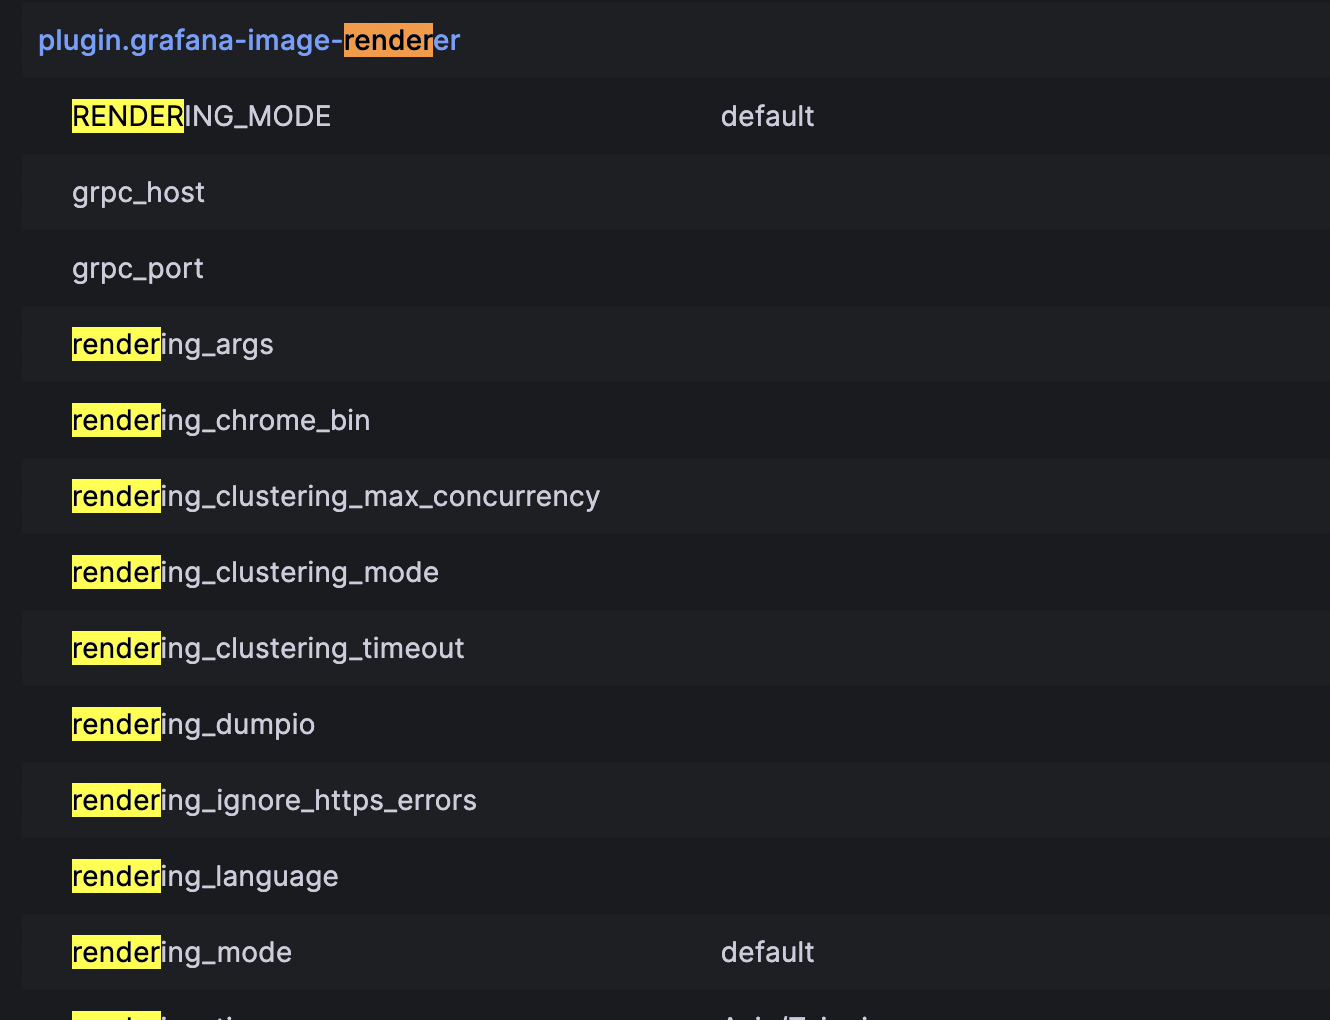
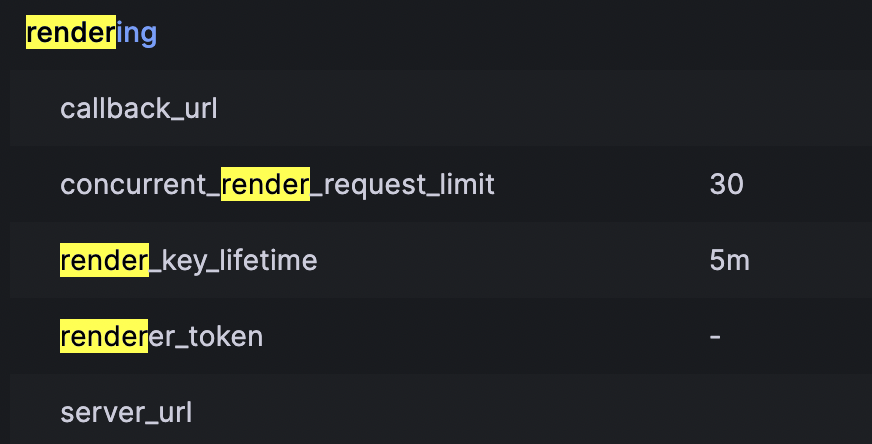
Next can you follow the troubleshooting steps here and let me know what logs you get for ngalert.image.
Hi
I’ve edit /etc/grafana/grafana.ini
but logging still does not show ngalert.image
I am looking for logs in this path.
/var/log/grafana
Am I missing something?
You should see debug logs on other lines than nglalert.image. If you don’t see debug lines at all I would think either Grafana is reading a different configuration file or logging somewhere else.
Could you tell me another configuration file or logging path?
I edited the file path at /etc/grafana/grafana.ini and /usr/share/grafana/conf/default.ini
and still does not show nglert.image
I see debug logs in the screenshot level=debug so it looks like the right file. You won’t see logs for ngalert.image unless an alert fires, so I would recommend creating an alert with the value of 1, or pausing and unpausing your alert rule from your orignial screenshot, and then checking the logs once it’s fired.
Hi
I have the following logs after following your tips
Could you find the problem in the logs?
Thank you for your help.
Update logs
I found Failed to take an image as following
what should i do?
Hi! This error means that the image renderer timed out loading the dashboard in Grafana (I see that capture_timeout is configured to 30s). How long does the dashboard take to open, including all panels?
Hi
It takes between 3s and 8s
Maybe I have to increase it?
Hi ,
i’m still have this issue,
anyone can help me to slove it?
HI @frank40202, have you increased the timeout? If yes, anything changed in the logs?


