Singlestat gauge doens't like negative values

Hi,

We’re monitoring some freezers (-80 celcius) and would like to show a gauge with thresholds.
But the gauge option doens’t seem to work with negative values.

The dashboard give an error:
Failed to execute ‘arc’ on ‘CanvasRenderingContext2D’: The radius provided (-3.62625) is negative.

Is there another way to do this, or maybe a workaround until this is fixed ?
I could use a function in the query to make the valeu absolute, like abs() ?
But I can’t discover how to do this.

Thnx,

Mike van der Hulst
Domoticom

It should work with negative values. Can you show a screenshot of your gauge options and thresholds?

Thnx for your reply. Attached a screenshot. It’s straightforward. When I check 'gauge’option i get an error, when I uncheck the gauge function and reload the dashboard it’s fine again

Why are min and max set to 0 for the Gauge? Change your min to allow negative values and it should work:

just tried that, same error:
Failed to execute ‘arc’ on ‘CanvasRenderingContext2D’: The radius provided (-3.62625) is negative.

could there be something wrong with the query ?

There are two things going on here:

  • If you want to get the arc drawn for the min/max, then you have to set the min that is smaller than the value being shown. (In your screenshot of the singlestat in edit mode, no arc is drawn).

  • If you make a singlestat panel really small, then Flot, the lib that we use for gauges will throw an exception:

    It looks like the panels in your screenshot above are just too small to draw the gauge. Trying making them bigger.

you are right, when sized up i get an arc. Thnx!

The gauge doesn’t follow the value though as can be seen beoolw.

I tried to use the same settings as you and it works for me:

Any more information you can provide? Is the query returning one value? What unit are you using (you were using Celcius before but I don’t see a Celcius symbol in the screenshot above)?

query is returning one value i think, because without the gauge option the singlestat is fine
I don’t know what happend to the celcius. I just created a new instance and set Unit to celcius, but no postfix

btw: I use GRafana 4.3.2 with Influxdb adn telegraph.

First, can you save the dashboard and reload the page, just to be sure there are no gremlins lurking there.

If it still does not look right then can you show the raw data and raw query by looking at the network tab in the Chrome Dev Tools. Here is a how to guide.

Looking at your query, it will return a lot of values. But is should work anyway, if you have chosen current as the aggregation in the singlestat options. Adding a last selector (by clicking on the plus after field(ActualTemperature)) will make it return one value.

current() is not in the list of aggregators

This is the network response:
{“results”:[{“statement_id”:0,“series”:[{“name”:“freezer1”,“columns”:[“time”,“ActualTemperature”],“values”:[[1496907600000,"-80.3"],[1496907900000,"-83.0"],[1496908200000,"-84.0"],[1496908500000,"-82.7"],[1496908800000,"-80.7"],[1496909100000,"-81.6"],[1496909400000,"-83.6"],[1496909700000,"-83.6"],[1496910000000,"-81.1"],[1496910300000,"-80.1"],[1496910600000,"-83.0"],[1496910900000,"-84.0"],[1496911200000,"-81.7"],[1496911500000,"-80.2"],[1496911800000,"-82.3"],[1496912100000,"-83.8"],[1496912400000,"-82.2"],[1496912700000,"-80.4"],[1496913000000,"-81.4"],[1496913300000,"-83.6"],[1496913600000,"-82.7"],[1496913900000,"-80.6"],[1496914200000,"-80.7"],[1496914500000,"-83.4"],[1496914800000,"-83.1"],[1496915100000,"-80.8"],[1496915400000,"-80.0"],[1496915700000,"-83.0"],[1496916000000,"-83.6"],[1496916300000,"-81.2"],[1496916600000,"-79.9"],[1496916900000,"-82.5"],[1496917200000,"-83.8"],[1496917500000,"-81.5"],[1496917800000,"-80.1"],[1496918100000,"-82.0"],[1496918400000,"-83.8"]]}]}]}
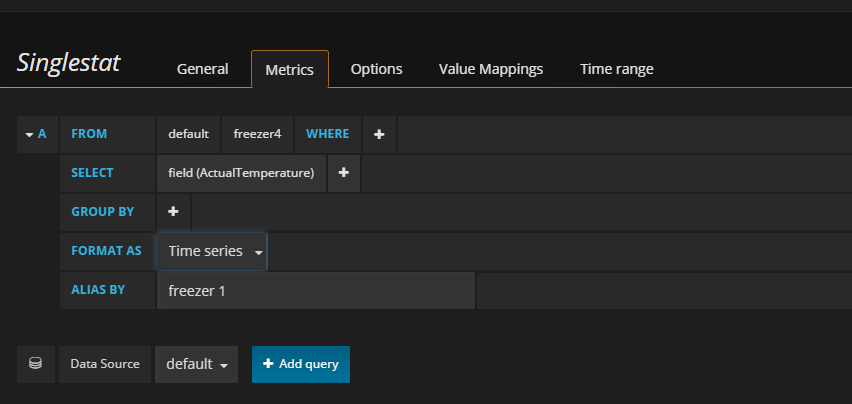
This is the query:
SELECT “ActualTemperature” FROM “freezer1” WHERE $timeFilter

You can choose to aggregate your data in the InfluxDB query (usually the best option) or Grafana can do it for you - the Stat field under the Options tab:

Saving and refreshing didn’t help?

Wait a second. Why are your values strings and not numbers?

yes, I used that one. Sorry, I was looking in the query for that option.
I discovered that when I add GROUP BY time($intercal) I get the celcius postfix.
But when Izoom out to 6 hours its gone, and zoom in to 3 hours the celcius is back…

aha, that doesn’t sound good. I don’t know why.
Probably in Telegraf ?

InfluxDB has a schemaless design so the first value written is the one that sticks and the type cannot be changed. And InfluxDB does not allow casts for strings either :pensive:

For any mathematical operations to work the field type has to be a number (integer or float) and that means you will have to add a new field for ActualTemperature and change your Telegraf configuration to write the data as a float.

Thanks a lot.!

I added this to the SNMP config in Telegraf:(new field in database)
conversion = "float"
And now the Dashboard works fine

1 Like