I am displaying average latency in seconds using Kibana and grafana gauge panel. Kibana displays 7.3s as avg whereas grafana display some number which is either less than kibana or greater than. How is this possible. I am using average metric and using “current” in singlestat options. Please advise.

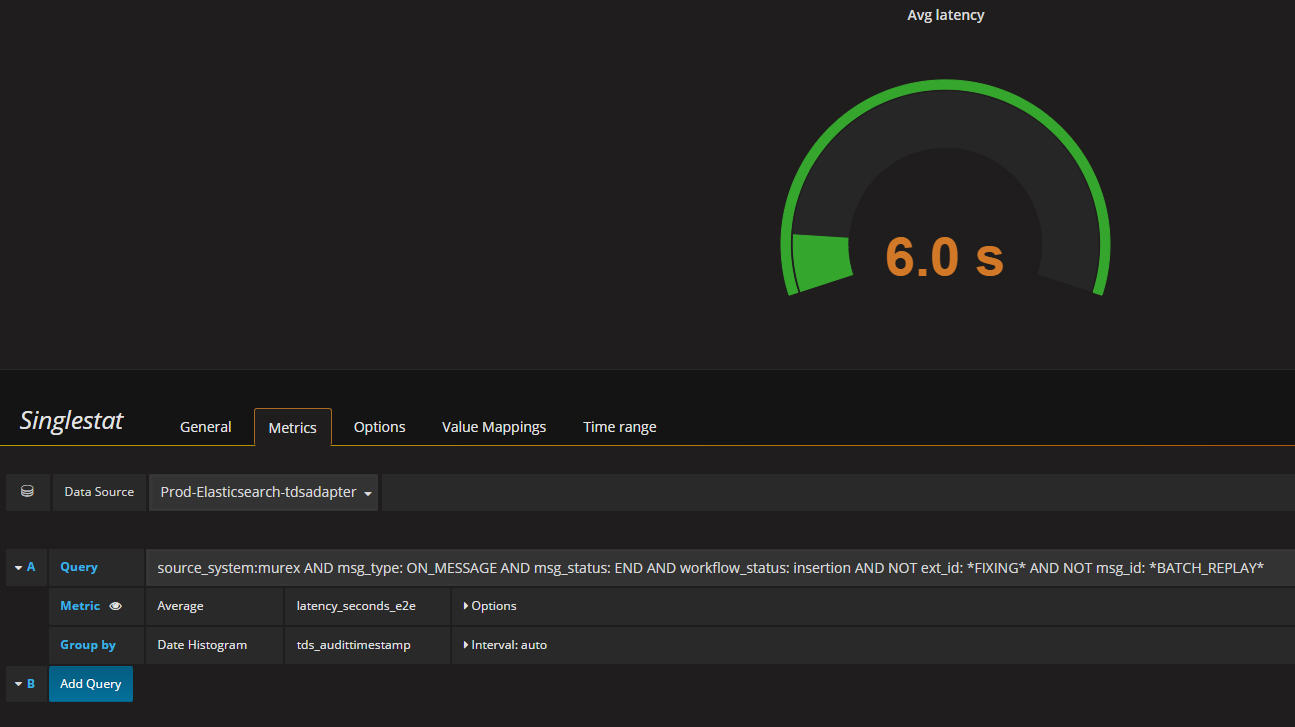
I have found the problem. Refer attached.
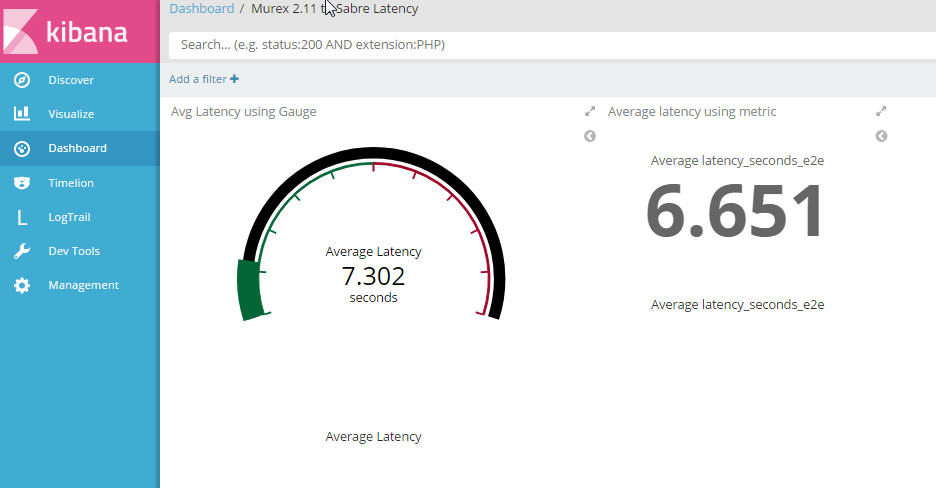
If I use “metric” in kibana then it matches with grafana provided I put 1y (1year) in the interval field as suggested by @torkel in another thread. Thank you.