Hello,
First of all, as this is my first message I want to say I love grafana and have been using it on projects for my work on multiple occasions.
At the moment I am unable to display a proper label for my PieCharts after a Merge & Group by transformation:

In the table view above I have the data exactly as I want it; I know how much time my heater has spent in which mode. I am trying to get a pie chart out of this:
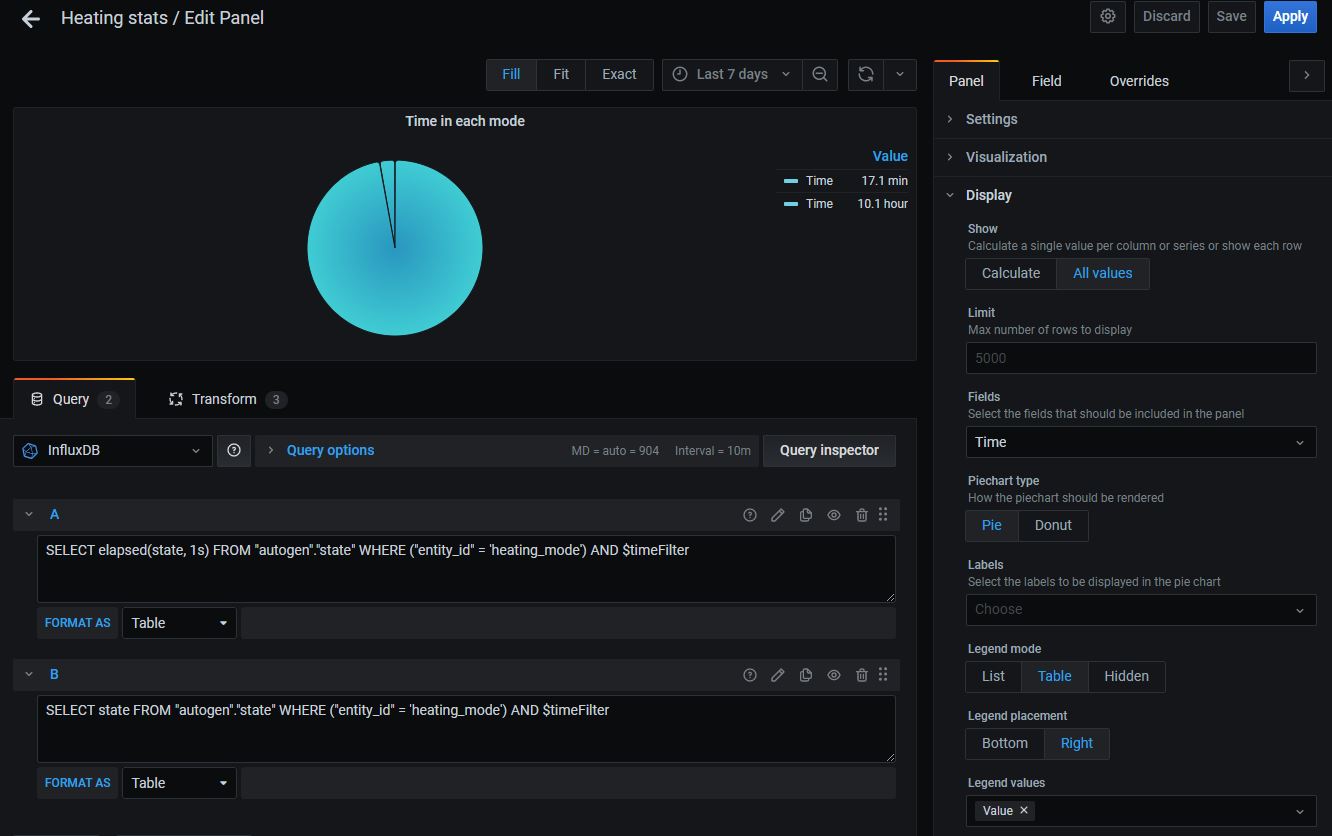
The issue is the Labels, one should be eco the other comfort, but I can’t seem to find how to do that. I was pretty sure I could use a variable in the Field > Display name but I couldn’t find the variable that could work.
Am I missing something?
Thank you for your support.