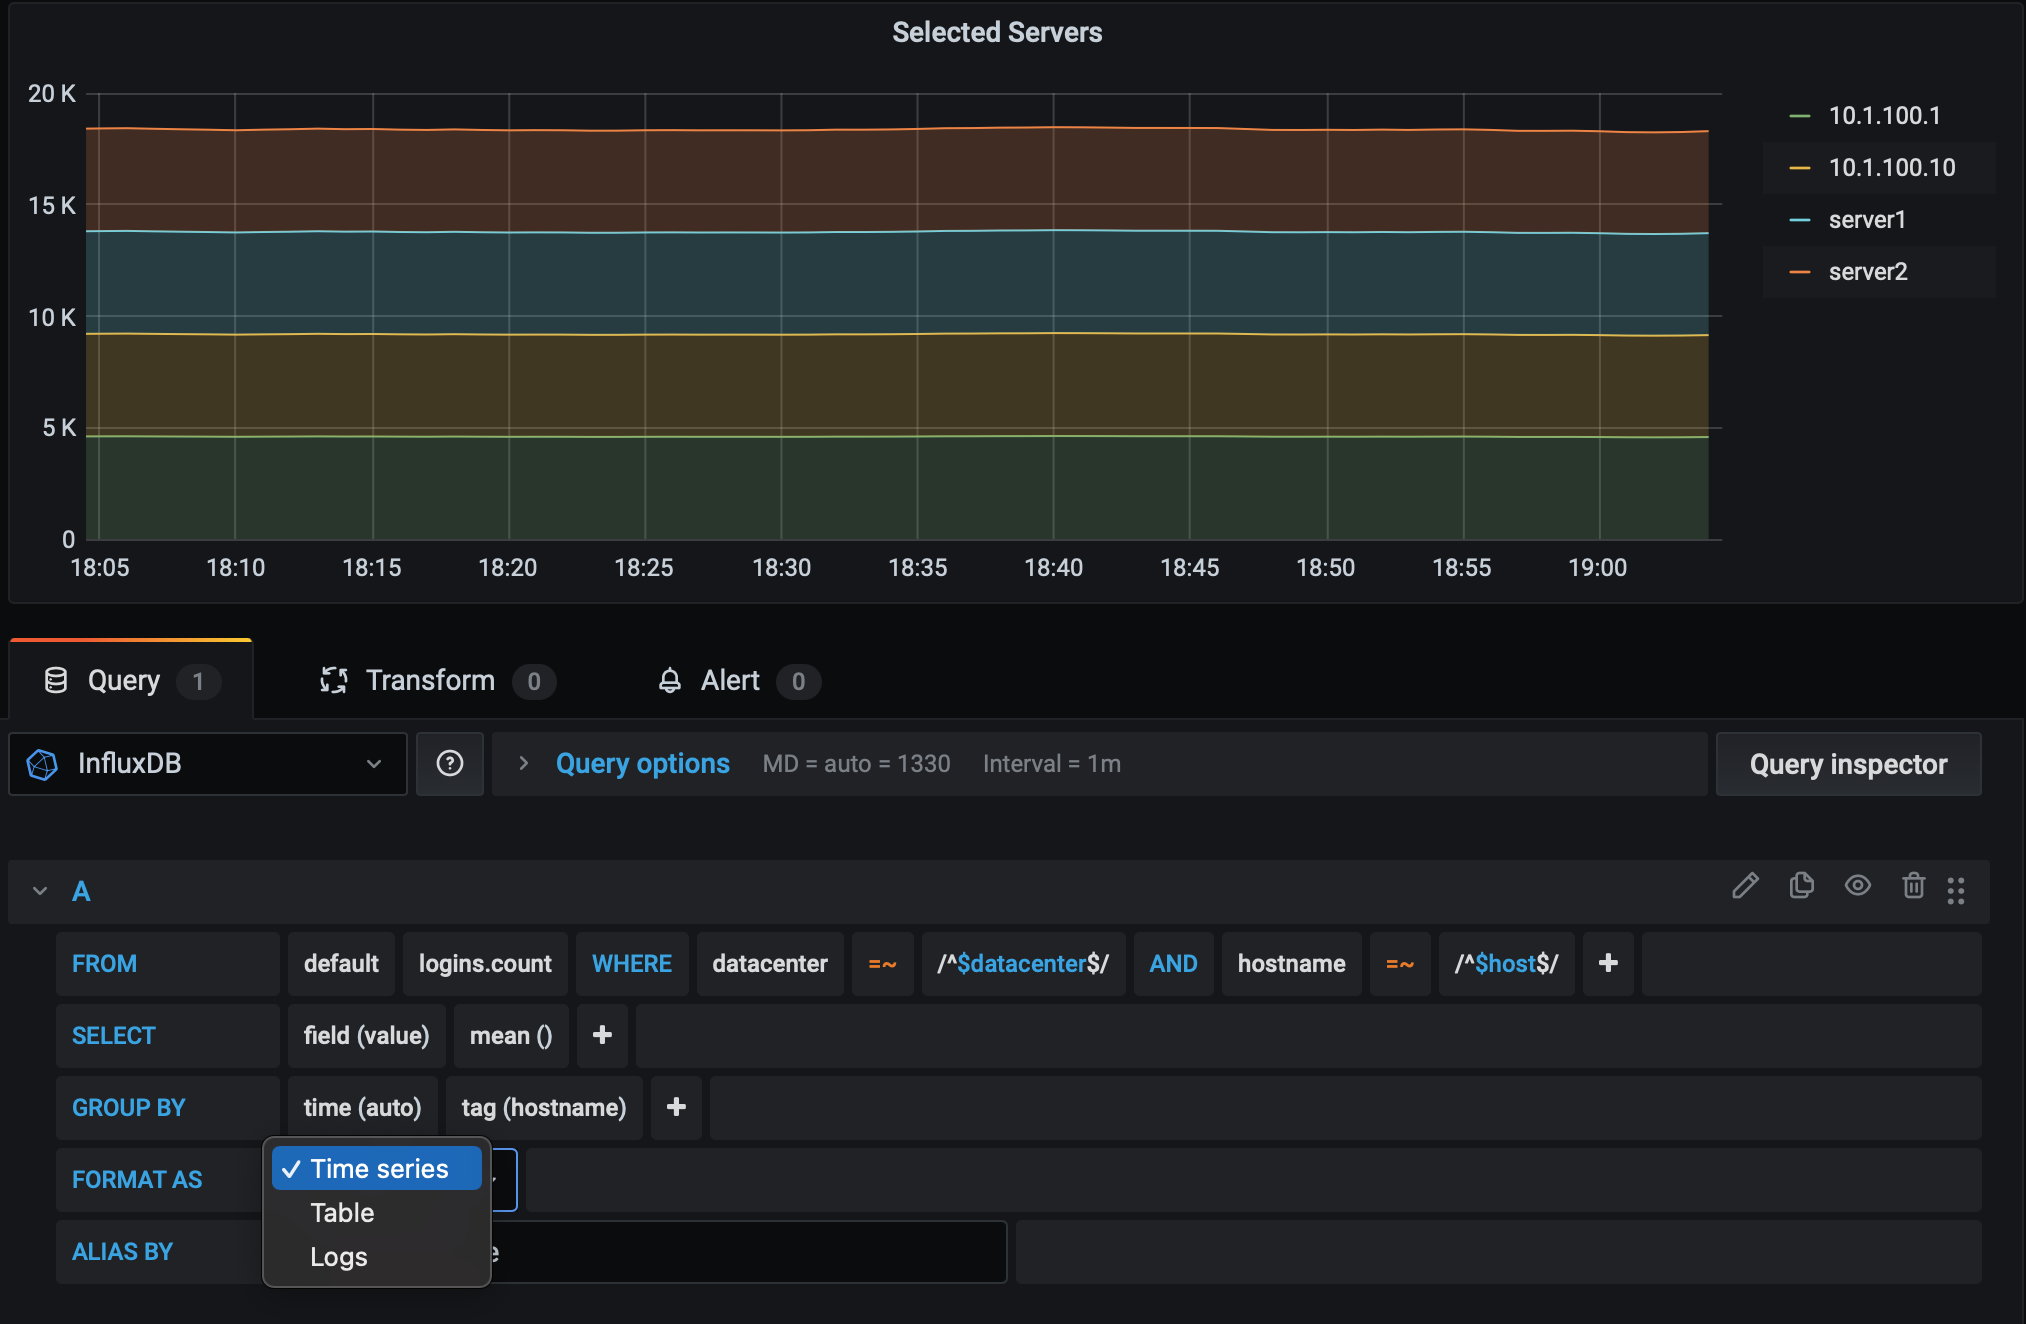
i need to represent data as a table and not graph using flux queries.
i don’t see the dropdown that has options to switch between table and timeseries once i select the data source to be flux.
please help
i need to represent data as a table and not graph using flux queries.
i don’t see the dropdown that has options to switch between table and timeseries once i select the data source to be flux.
please help