The table doesn’t show me all rows at once. As you’ll see in the screenshot, there’s a dropdown select box below the data in the table. When I open it, for each VMwareRawData6 option I select, the table shows two different rows. I want all of them to be in a single table without selecting them from the dropdown menu. There should be hundreds of rows like this. But it shows the rows in pairs by selecting from the dropdown select box. How can I display all the data in the table in a single place without selecting from the dropdown?
In influxdb 1.8 i was able to display all data in one table with below query :
SELECT hier_1_id, Policy_Type, Master_Server_Name, Policy_Name, Client_Name, Schedule_Type, Job_Status, Job_Status_Code, Start_Time, End_Time, Duration_Minutes, Written_Size_GB*1024 as Written_Size_MB, Real_Size_GB*1024 as Real_Size_MB, throughput_MB_per_sec FROM "Vxxxxx_Dashboard" where time > now() - 32d
So it was showing all rows in one table. But now with Flux and influx 2.7 i cannot get all data in one table. I have to choose from dropdown under the table to see data seperately.
When i try to add field from calculation thousands of fields are comin as you can see in screenshot. If i remove labels to fields transformation than again thousands of filed names are coming with concatanated column names.
This is happening because your Flux query does not have any more |> filter statements (besides the existing one for the measurement). Is there any reason you have not added more filter statements?
Because i need to see all data in one table. Let me explain in more detail what i am doing.
I have 15 column data. 6 columns are tags 13 columns are fields.
I create this data with my python codes as pandas dataframe. When i print the dataframe i can see 25000 rows with 15 columns as a table in one 15 x 25000 table.
Then i write this dataframe to influxdb2.7.4 db. While writing, i also mention tag_columns. Now i need to see this data in grafana table like i see in pandas dataframe output.
When i try influx v1 shell on current influxdb 2.7.4 and run command : “select * from VMwareRawData6” i can see the data as a full table like i see in my python pandas print(dataframe) table.
I need to see in grafana like i see the output in python dataframe or influx v1 shell output.
Let me share some of my codes where i write to influxdb.
#joined_df is dataframe created from collected data from several sources

def write_dataframe_to_influxdb(df, measurement, tag_columns, protocol='line'):
    try:
        for index, row in df.iterrows():
            point = Point(measurement).time(row['Index_Time'], WritePrecision.NS)
            for tag_col in tag_columns:
                point.tag(tag_col, str(row[tag_col]))
            for col in df.columns:
                if col not in tag_columns:
                    value = row[col]

                    if isinstance(value, pd.Timestamp):
                        value = value.timestamp() * 1000
                    point.field(col, value)
            write_api.write(bucket=bucket, org=org, record=point, protocol=protocol)
    except:
        log_error_message(f"Influxdb write error.")

# InfluxDB 2.7.4 info
token = "xxxxxxxxx"
org = 'Vorga'
url = "http://1.1.1.1:8086"
bucket='Vbuc'
measurement = 'VMwareRawData'
tag_columns = ['Job_Type', 'Client_Name', 'Policy_Name', 'Policy_Type', 'Schedule_Type', 'Master_Server_Name']

client = InfluxDBClient(url=url, token=token, org=org)
write_api = client.write_api(write_options=SYNCHRONOUS)

write_dataframe_to_influxdb(joined_df, measurement, tag_columns)
log_info_message(f"Influxdb written.")

client.close()
log_info_message(f"Influxdb conn closed.")
I open linux cli on which influxdb 2.7.4 is running.
Then i run command : influx v1 shell.
Then i enter influx shell.
Then i run command : select * from measurement.
Then it gives below screenshot output.
The below screenshot table is the table i exactly need to see in Grafana table.
I think i understand problem.
When i run “select * from VMwareRawData11” query in v1 shell on influxdb2.7. I get 211 rows.
When i added the number of rows shown by choosing red rectangled dropdown choices one by one, the total number is 211 again. But it shows seperately all 5 red dropdown choices. I need to see all 211 rows together. For example when i choose first red choice it shows 67 rows, second red choice it shows 3 rows, third choice 46 rows, fourth choice 58 rows, fifth choice 37 rows. When i add them i find 211 rows. But it shows seperately by choosing.
How can i display all 5 choice resulting rows together in one table. How can i concatanate them in one table.
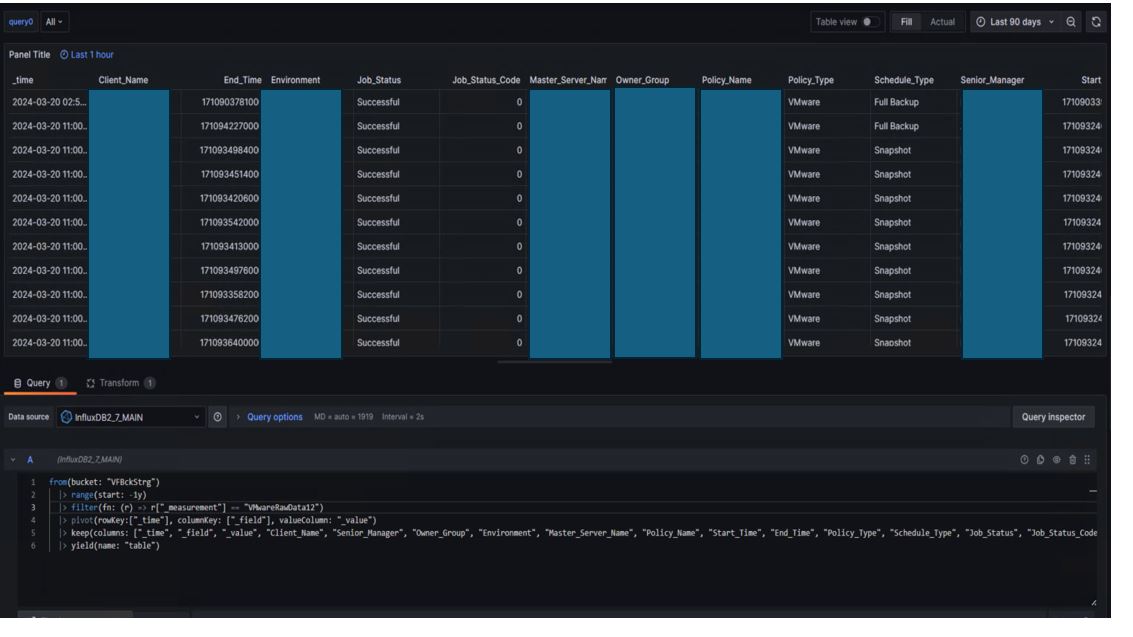
I’m here too of course, and I just saw something weird with your query.
You are using the pivot function, which will transform every value of a tag to a field. " The pivot() function in Flux is used to reshape tables by converting unique values in specified columns into new columns.":
Let’s make your measurement: