Ok that’s great as I suspected you had a problem elsewhere.
With normal meters, they maintain a real-time clock all of which should be synchronized to the mains so that they have a common time reference. In your case, you will have to rely on or ensure that the time at each device is set as accurately as possible.
Meters also have accumulative registers and load profile registers which may be reset every say 15/30 minutes
As you note it appears each device appears to have different times as well as different reset intervals.
This is not a problem and one which every utility faces when analog meters rollover. This requires you to first clean your sensor data and rather make each appear as they are ALL accumulative data only. This will then make all meters appear as if they are all accumulative data only. This is overcome by doing a running sum on all the data for every meter.
This will make the data for each meter appear as a continuously increasing line of energy for each and every meter. This will then remove any issues related to rest or rollover interval.
The next is to account for the time skew in each meter, to do this you will have to make one sensor time series start time the reference time and then adjust each of the other time series by the same amount. Best to choose the earliest first sample of all the meters.
So now you will have resolved the time skew but each sensor might have data gaps including the reference meter. So what you now have to do is do a join of all the adjusted time series to get a master time series that includes the timestamps for each and every sensor.
So now you have a common timestamp that includes all the adjusted timestamps for all readings in all sensors and all energy data for each of these are all accumulative data.
Now they may be summed using a 1 hour group and the difference in each 1 hour summation used as you are doing
A AAAA AAAA A AA A AAAAAAAAAA
BB BBBBBBBBBBBBBBBBBBBBBBB BBBBBBB BBBBB
CCCCCCCCCCC CCCCCCCCCCCC CCCCCCCCCC
first remove time skew use series A as reference
A AAAA AAAA A AA A AAAAAAAAAA
BB BBBBBBBBBBBBBBBBBBBBBBB BBBBBBB BBBBB
CCCCCCCCCCC CCCCCCCCCCCC CCCCCCCCCC
Now Do JOIN
ABCAAAABBBBAAAABABAAABBBBBCBBBBBAAAAAAAAAA
BB BBBBBBBBBBBBBBBBBBBBBBB BBBBBBB BBBBB
CCCCCCCCCCC CCCCCCCCCCCC CCCCCCCCCC
So now you have a common time series that accounts for the time skew as well as missing gaps.
The only problem is now the gaps and one would have to interpolate. However, this will autocorrect when all series have data at a common timestamp
Anyway hope this helps.
The skew and missing gaps may be readily done, but easily rectified, but is doable.
The above might be far easier to do using Tableau Public.
The best is to use meters that can be linked with ethernet and have synched time stamps but missing data still is a problem.
Normally devices allow one to choose the rest period. Some have daily, monthly and annual registers as well. Send me the device type and manual and I can have a peek.
DM me to gregdiana1@gmail.com.


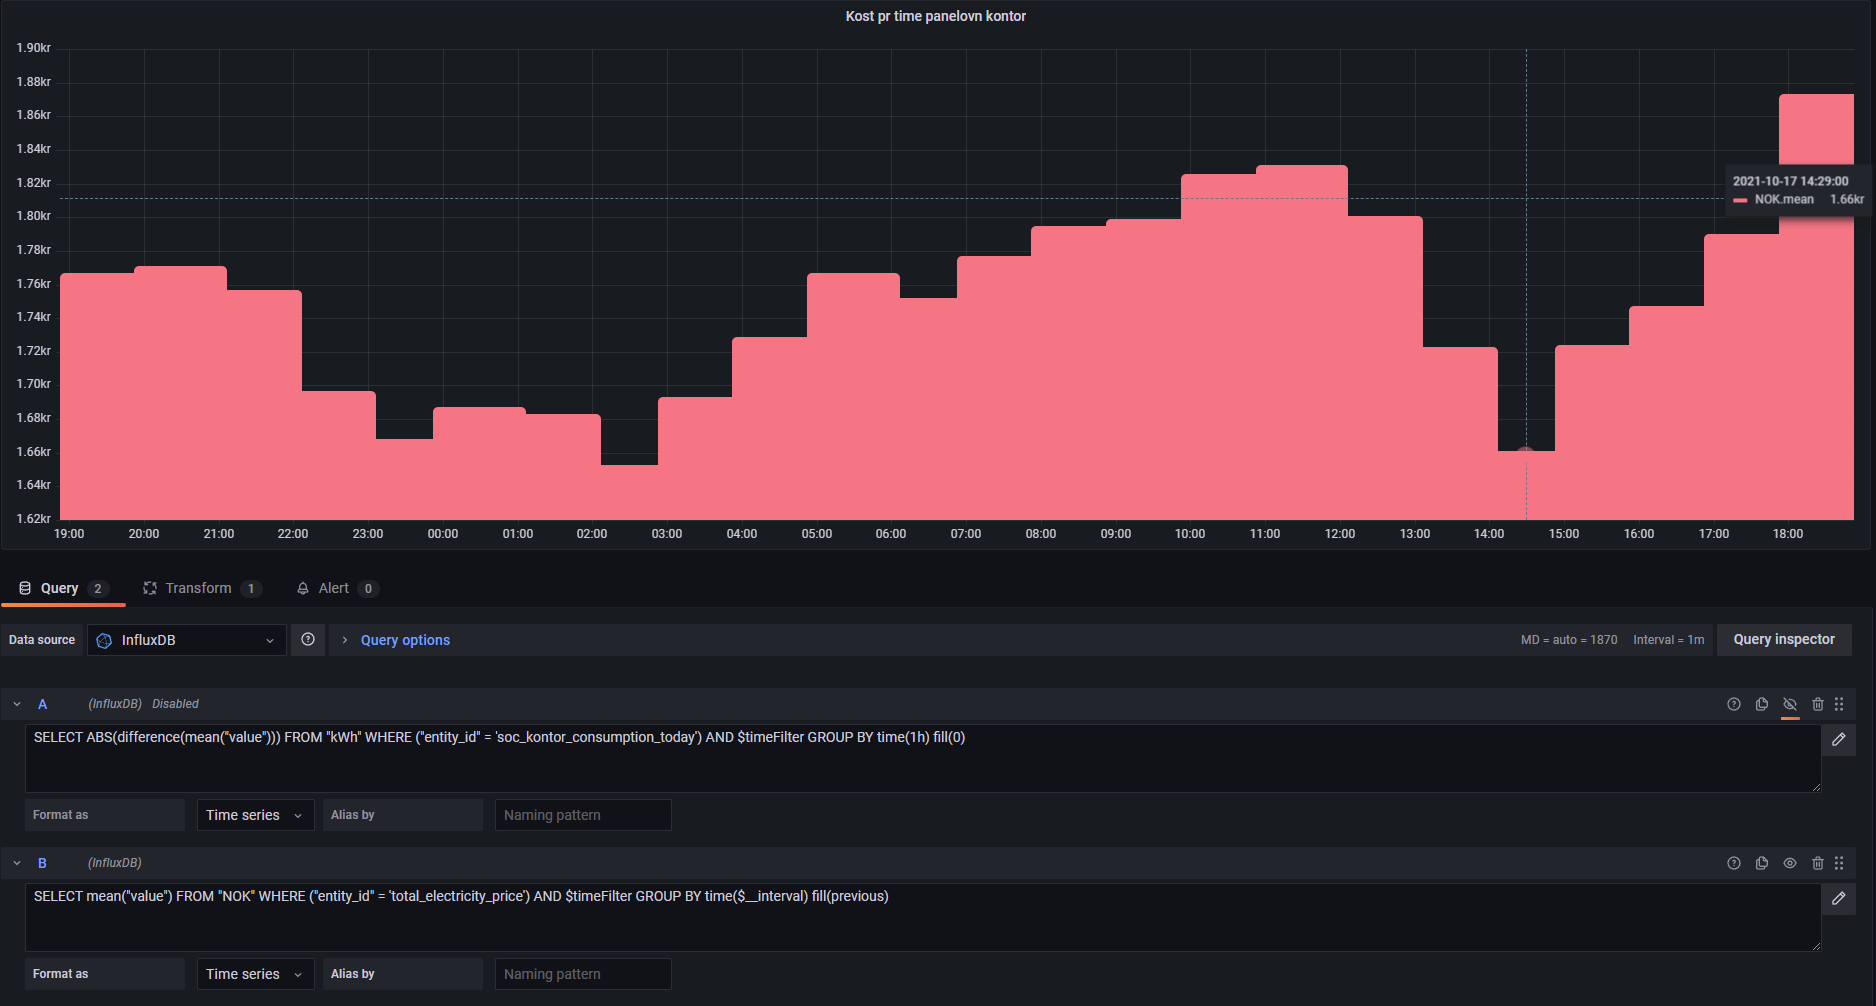
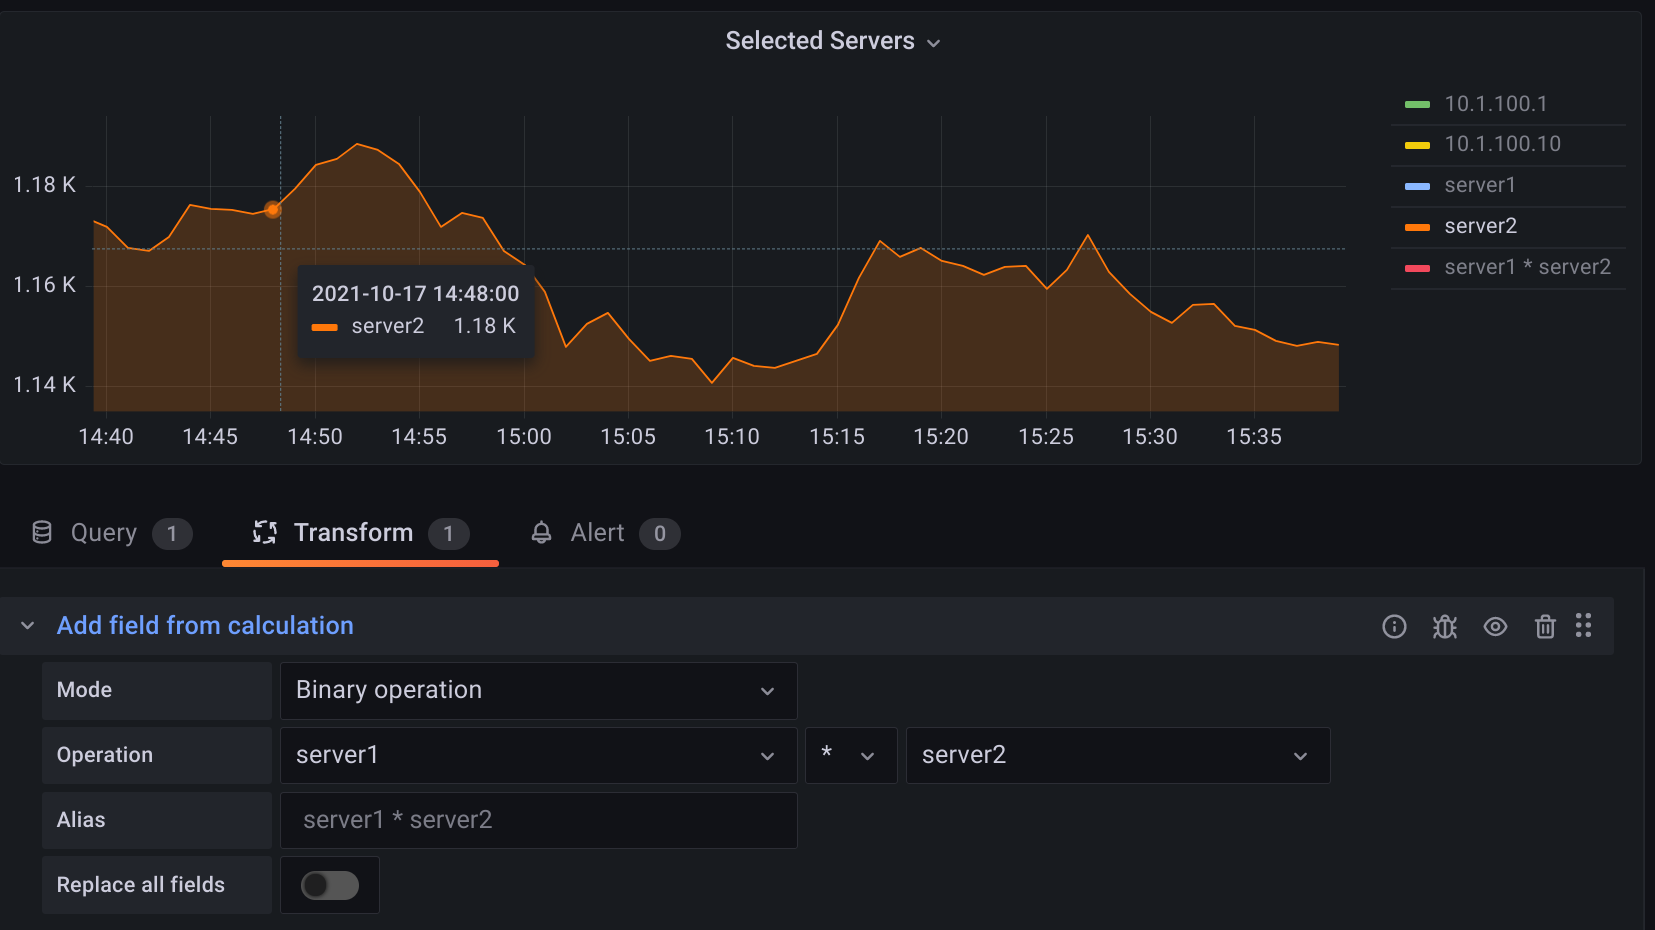
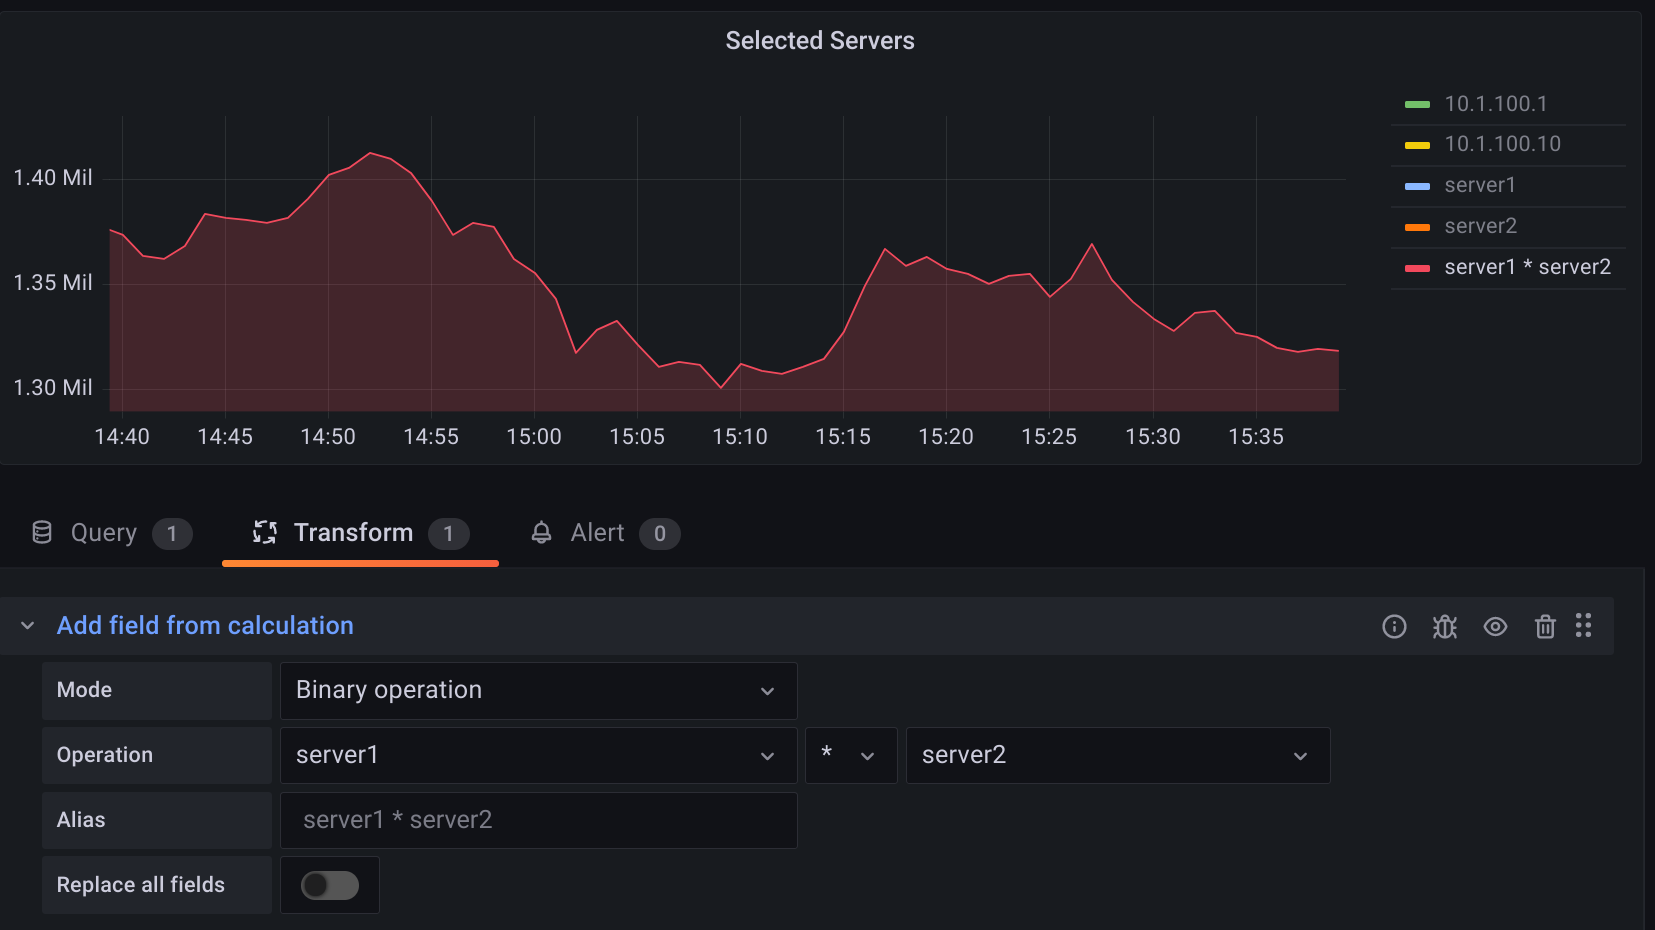
 If you look closer, I have an transformation to multiply kWh and NOK to get the usage cost. If I choose to view only the kWh, everything looks OK, but I won’t get the calculation I’m after. It looks like something strange is happening in the transformation.