at first Merry Xmas and stay healthy to all.
I got a problem with a Integral Query via InfluxDB in Grafana. I got a table with positive and negative power-values from my house-grid in Influx DB (time is in seconds, power in Watt). Positive is power that serve the provider, negative is the power that i sell to the provider from my PV-Installation. Now i want to separate the table in “power from provider” and “power to provider”, integrated and grouped for each day in kWh.
compared with the app from the pv-provider I have huge deviations for each day. So i tried several things to get the values closer with no success. What i found out is: Changing the time range in Panel to one specified day gives another result for the Integral.
Accuraccy of derivation/integration approach depends on the sampling frequency. I wouldn’t expect perfect match with your pv-provider (unless you have second sampling frequency).
I would try to add time aggregation where time match sampling frequency and fill 0 -> so zeroes will be returned for negative values.
Then integration again calculated per sampling frequency + some math for Wh calculation.
And last aggregation will be summing per day.
Quite “simple” tripple aggregation for not the best metric format - of course you won’t be able to use UI editor - you will need to toogle editor mode and write subqueries manually.
Thank You. I´m a little bit lost. Maybe you can help me to dive a little bit deeper in your mind. I think i can follow you in mind, but i don´t know how to realize it in detail in grafana.
What I think:
about time aggregation: i need a table with defined time intervals, aggreated with the timestamps of the database entries? empty fill with zeros, then integrate and summarize per day?
Generic approach - please don’t blame if it doesn’t work for your use case - unfortunately you didn’t provided sampling frequency (assuming 5m), queries are images (I really don’t want OCR that weird measurement name), I don’t have your dataset. This is help only, not copy&paste query. Yes, there can be syntax error, it may give you still wrong result, but it is only direction. Please fix it on your own.
1.) “Normalize” dataset - 0 instead of negative values:
SELECT MEAN(value) AS mean
FROM measurement
WHERE value < 0
GROUP BY time(5m) fill(0)
2.) Next step add integral (+ some math will be required as well to have proper Wh value - pls develop it on your own)
SELECT INTEGRAL("mean", 5m) AS integral
FROM (
  SELECT MEAN("value") AS mean
  FROM "measurement"
  WHERE "value" < 0
  GROUP BY time(5m) fill(0)
)
3.) Finally summing per day:
SELECT SUM("integral") AS sum
FROM (
  SELECT INTEGRAL("mean", 5m) AS integral
  FROM (
    SELECT MEAN("value") AS mean
    FROM "measurement"
    WHERE "value" < 0
    GROUP BY time(5m) fill(0)
  )
)
GROUP BY time(1d)
Perfect, Got it with one Subquery. Grouping per Day integrated in the integral query is the solution with minimal deviation compared to the App from the Provider.
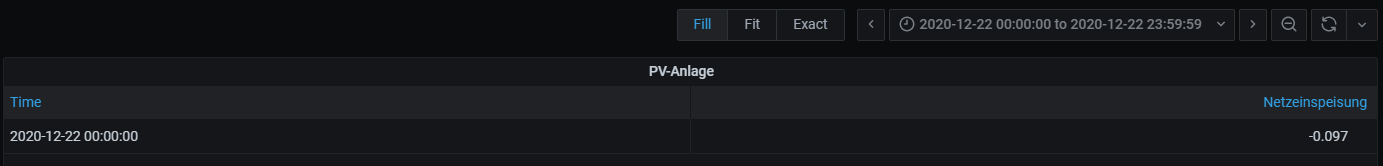
for example the code for the integral which only integrates negative values, positive and empties are fitted with zero:
SELECT integral("mean")/3600000 FROM (SELECT mean("value") as "mean" FROM "autogen"."senec.0.ENERGY.GUI_GRID_POW" WHERE ("value" < 0) AND $timeFilter GROUP BY time(5s) fill(0) tz('Europe/Berlin')) WHERE $timeFilter GROUP BY time(24h) tz('Europe/Berlin')
Result is delivered Power in kWh to the provider from my PV-installation per day.
I have the same setup, where i’m getting data (watts) from an MQTT broker (via NODE-Red) to InfluxDB (and MQTT-Datasource) in Grafana on Unbuntu.The data Im getting is from my solar panel system which generates power so it will always be positive.
But, where exactly do I use or place the above code? In influxDB or Grafana?
Hi @antonio79: The SELECT queries written in the posts above are InfluxQL (not Flux) that are to query the Influx data so that it appears correctly in Grafana. It seems the solution outlined above is successful, but you (and probably others) need this written in Flux. Probably best answered by the people on the Influx forum.
To answer your question, the lines of queries would be written in the “A” box below…
SELECT integral(“value”) / 3600000 FROM “W” WHERE (“entity_id” = ‘active_energy_import_total’) AND $timeFilter GROUP BY time(1h) fill(null)
When the selected period is the whole day, there are a few hours with the wrong data.
But data is correct when I select that specific hour.
I even found a specific minute with this problem.
Whole day period result: 0.649
Specific hour result: 0,00268
The data in DB are:
|2022-04-13T11:54:00.000+03:00||
|2022-04-13T11:54:10.000+03:00|538|
|2022-04-13T11:54:20.000+03:00||
|2022-04-13T11:54:30.000+03:00||
|2022-04-13T11:54:40.000+03:00|0|
|2022-04-13T11:54:50.000+03:00||