I am using Grafana v10.0.3 with InfluxDB 1.8 and I would like to split up an energy meter kWh field, which has positive and negative values (import/export), in two separate fields (one for positive values, the other one for negative ones) that I can show the sum of all imported and all exported energy.
The total field is calculated by the sum of multiple import and export meters.
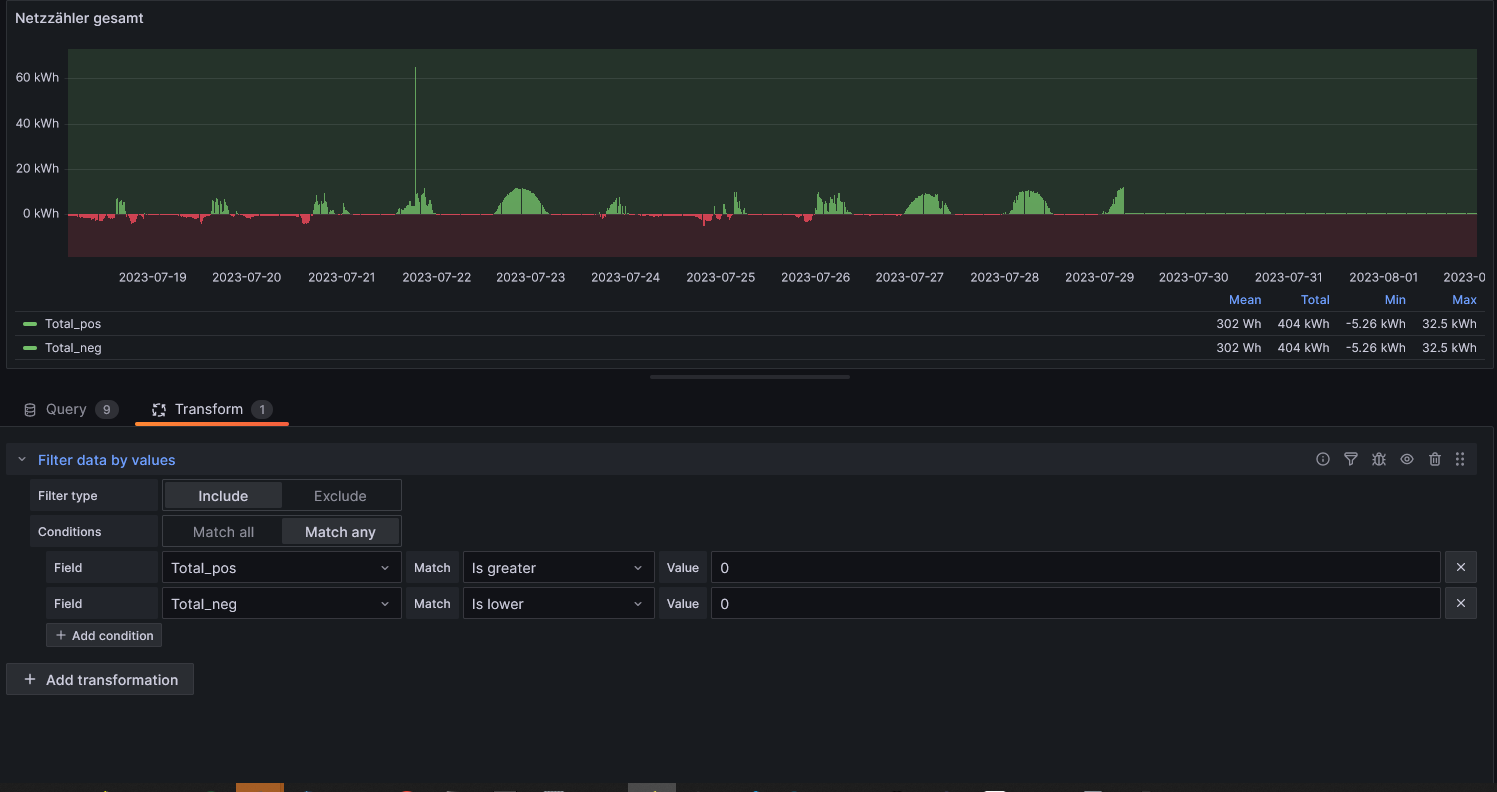
I thought it might work to make the field twice (total_pos and total_neg) and just filter it then, but it looks the calulcated values (min, max, average, total) don’t care about the filter.
Is this the way how it should be?
So far as I understand is this not possible, because the total which I calculate depends on the sum of all meter (Z).
For this reason was it my idea to duplicate the total into total_negativ and total_positive and filter these values then somehow, ether in the expression or after it.
This is how the energy meters (Z) are connected to each others and I want to calulate its total within 15 minutes.
Z = energy meters (separate positive/negative kWh counters)
G = generator which represents the energy producer (which is actually a photovoltaic inverter)
M = motor which represents the energy consumers.
Each meter accumulates positive as well as negative values, but within 15 minutes all positive and negative values compensate each other and I want to show that in the total calculation which works so far, since I just have to make the drawn values negative and build then a sum of all meters.
This sum I want to split up in a positive and negative field that I can create a min,max, average and total calculation from the drawn as well as delivered energy.
Since I am not able to upload .txt or .csv files here, I just renamed the .csv files to .json files.
I did export this data by the software ioBroker which is also recording the data (not sure how else I could get the data), hope this is the data for wich are you looking for.
Already indicated how you can post inline data here
Just open the csv file you have linked with notepad select all copy and then paste the content of the csv here. Not the file because none of us can load any file in this forum
ok now we see your data posted to this forum. Do you care explaining what each represent before we ingest it into our local influxdb? DG.DRW.W, ReverseActive vs PositiveActive.
DLV = delivery (positive values)
DRW = draw (negative values)
All these are kWh counters which increase all the time and for that reason spread() is used to get the consumed/delivered kWh in a certain time frame.
Z2_DRW (gets converted to negative):
mqtt-client.0.WR.WR2.Meter.ReverseActiveEnergy
Z3_DRW (gets converted to negative):
mqtt-client.0.EMTR.DG.DRW.W
You can also see the the queries and conversations I have used there:
I added some .json files which I exported from the panel, maybe these help as well: Datafame.json (440.3 KB) Panel Data.json (494.4 KB) Panel.json (9.7 KB)
In my example, the transform looks like it is only using positive or negative values in the legend calculations. Are you able to use the Panel>More>Get Help option to share a copy of your panel with randomized data that we can look at? I’m wondering if it’s specific to the datasource, visualization, or if there is some other dashboard setting that’s causing the result you’re seeing. Have you tried creating this panel from scratch in a new dashboard?
Because I consume on 3 phases and produce on a single phase, the production is what I sent into the grid on that phase where the converters are. My queries on the dashboard are like this:
> show series from actual
key
---
actual,phase=1
actual,phase=2
actual,phase=3
> show field keys from actual
name: actual
fieldKey fieldType
-------- ---------
consumed float
produced float
> select * from actual where time > now() - 15s
name: actual
time                consumed phase produced
----                -------- ----- --------
1691133995509944118 0.109    1
1691133995509944118          3     0.788
1691133995509944118 0.268    2
1691134005534068594          3     0.75
1691134005534068594 0.262    2
1691134005534068594 0.109    1