
Hello team,
I’m using a Grafana dashboard with Prometheus as the underlying data source. For some PromQL queries, I’m seeing an unwanted warning message:
`PromQL info: Metric might not be a counter — name does not end in _total, _sum, or _bucket: custom_random_gauge`
I would like to understand how to permanently suppress or eliminate this warning.
this is how warning looks like
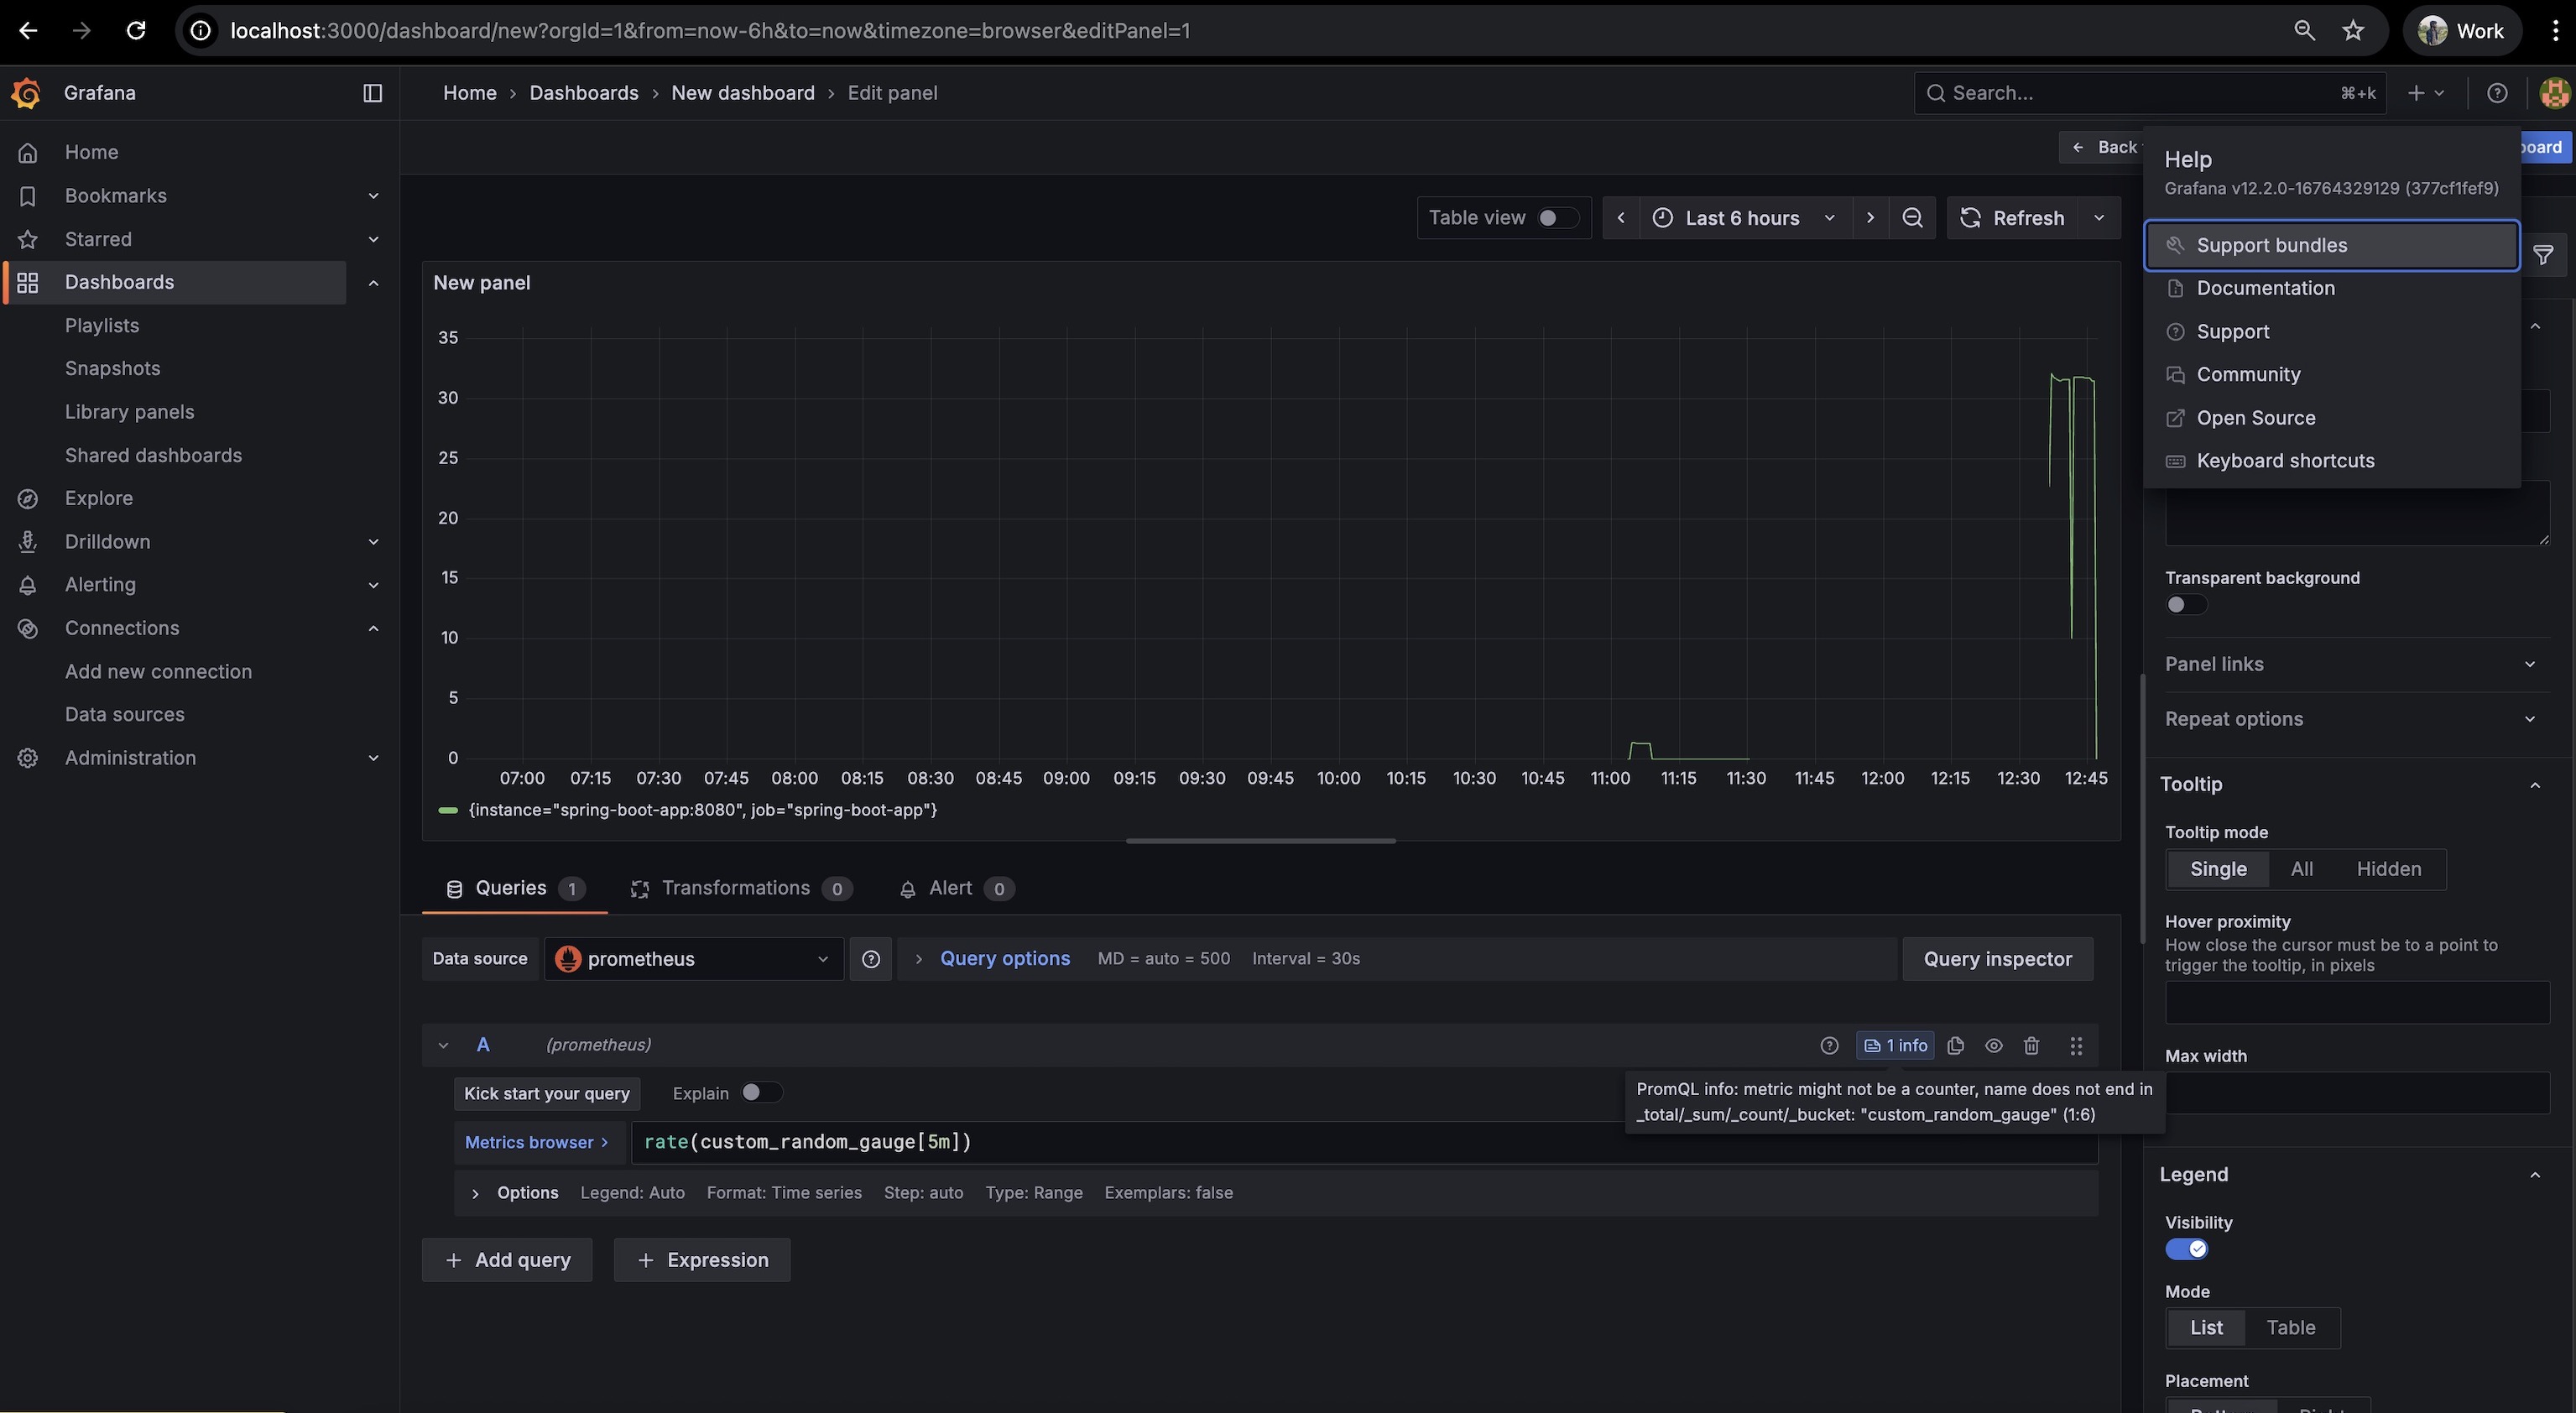
To reproduce this issue, I created a minimal Spring Boot application that exposes a custom gauge metric (custom_random_gauge). I ran this locally and tested with different combinations of Grafana and Prometheus versions.
Here’s a summary of my observations:
| Column 1 | Column 2 | Column 3 | Column 4 |
|---|---|---|---|
| Prometheus Version | Grafana 10.4.2 | Grafana 11.4.0 | Grafana 12.0.2 |
| 2.52.0 | Warning shown | Warning shown | Warning shown |
| 2.55.1 | Warning gone | Warning gone | Warning shown |
| 3.5.0 (latest) | Warning gone | Warning gone | Warning shown |
I also found this GitHub issue that appears to be related:
https://github.com/grafana/grafana/issues/84636
My Question
Could someone from the team please clarify:
-
Why does this warning appear only for specific combinations of Prometheus and Grafana versions?
-
Is this behavior expected or a regression?
-
Is there a recommended way to disable this warning for custom metrics that do not follow the
_total,_sum, or_bucketnaming convention? -
Can a future upgrade reintroduce the warning even if it’s currently not shown?
Since our applications may be upgraded independently of Prometheus/Grafana, we want to ensure that the warning doesn’t unexpectedly return in future deployments.
Thanks in advance for your help and clarification.