-
What Grafana version and what operating system are you using?
I am using Amazon’s Managed Grafana, v9.4.7 -
What are you trying to achieve?
I am trying to build a dashboard that displays a gauge of single metrics which are available through the Prometheus data source -
How are you trying to achieve it?
Building a dashboard panel -
What happened?
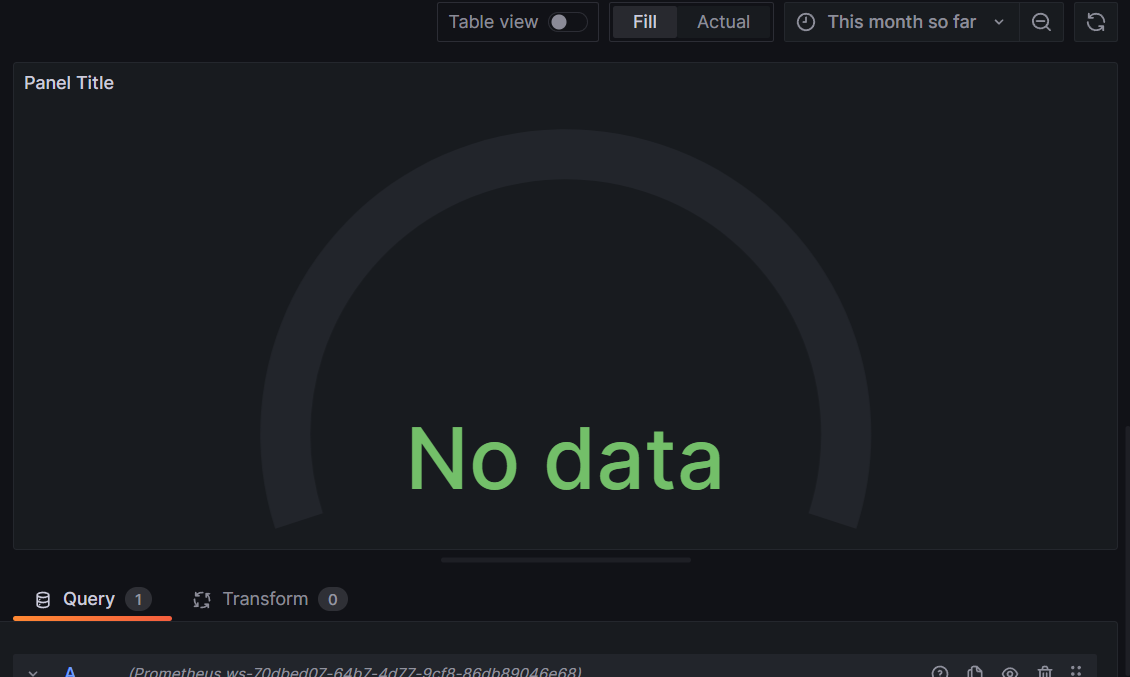
When I increase the timespan of the query, for some reason it excludes certain metrics. I am doing a SUM of this metric across the timespan. When I look at the last 6 hours, I can see the accurate count that I expect. However, when I look at the last 7 days, the number decreases by more than half. When I choose “This Month” for the timespan, it says No Data. Why would this be? Does it have to do with the interval? -
What did you expect to happen?
I expect the count that shows up to be at least greater than the last 6 hours for a larger timespan, since there are more metrics. -
Can you copy/paste the configuration(s) that you are having problems with?
-
Did you receive any errors in the Grafana UI or in related logs? If so, please tell us exactly what they were.
No -
Did you follow any online instructions? If so, what is the URL?