Hello! I am working on connecting Grafana and Prometheus to track specific data. I have created a table to track Twitter followers, but something seems to be going wrong.
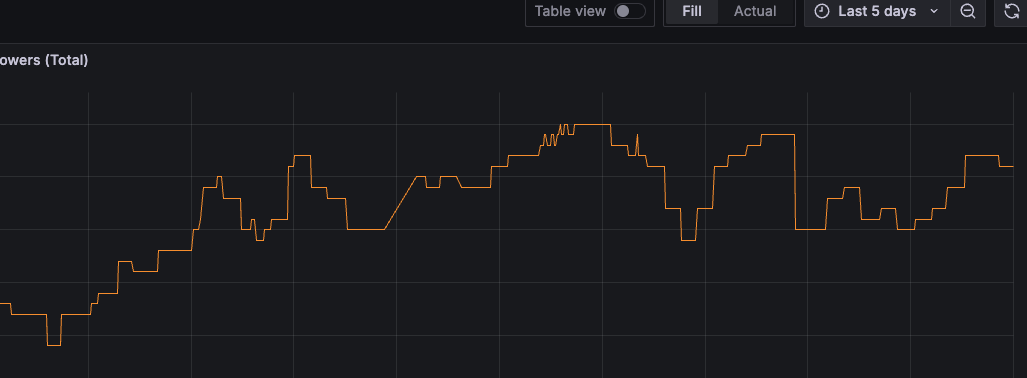
As you can see, the table displays correctly from the present to a certain date in the past.
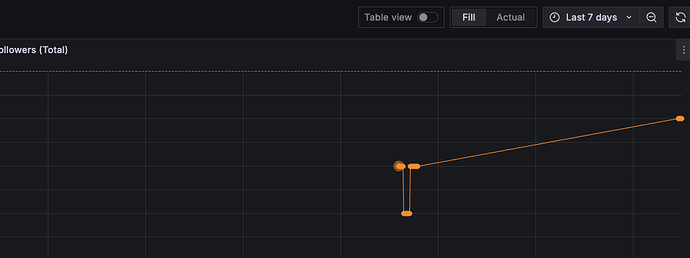
However, after a certain date (the last 8 days), most of the data suddenly disappears from the table. (Even when checking the Table View, the data itself is missing.)
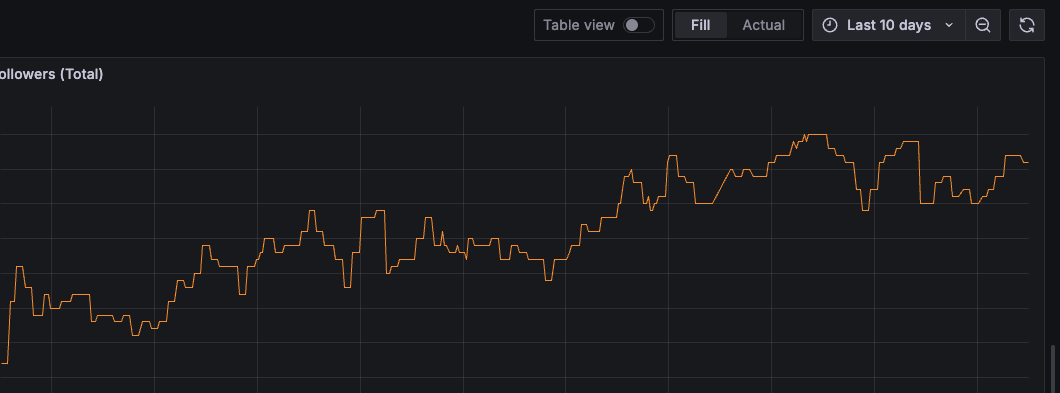
What is even more peculiar is that if I set the range to start after this certain date (the last 10 days), the graph is displayed correctly again.
The interval and minstep are set to be sufficiently smaller than the actual scrape interval.
The query used is very simple and directly retrieves the value (twitter_followers_count).
The Grafana version is v10.4.0.
The Prometheus version is v2.51.1.
What could be the issue?
Thank you.


