Grafana version: 9.3.6
I have this query
SELECT
  $__timeGroupAlias(start_time,$interval),
  http_status_code as "Status",
  COUNT(*) as "count"
FROM lassie_logs
WHERE
  $__timeFilter(start_time)
GROUP BY 1, 2
ORDER BY 1
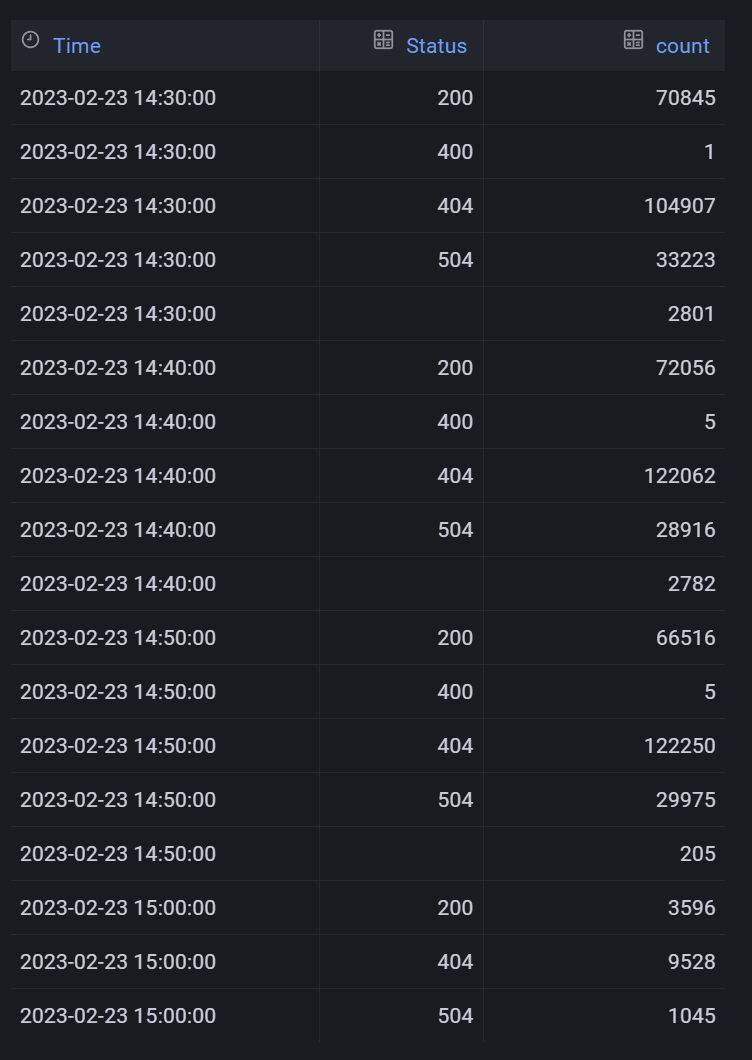
which produces this data
I want a time series chart with 1 line per “status”, y axis being “count”
The docs describe my exact situation, except their example query doesn’t include a group by.
The “partition by values” transformation seems to do what I want, but it creates extra labels?
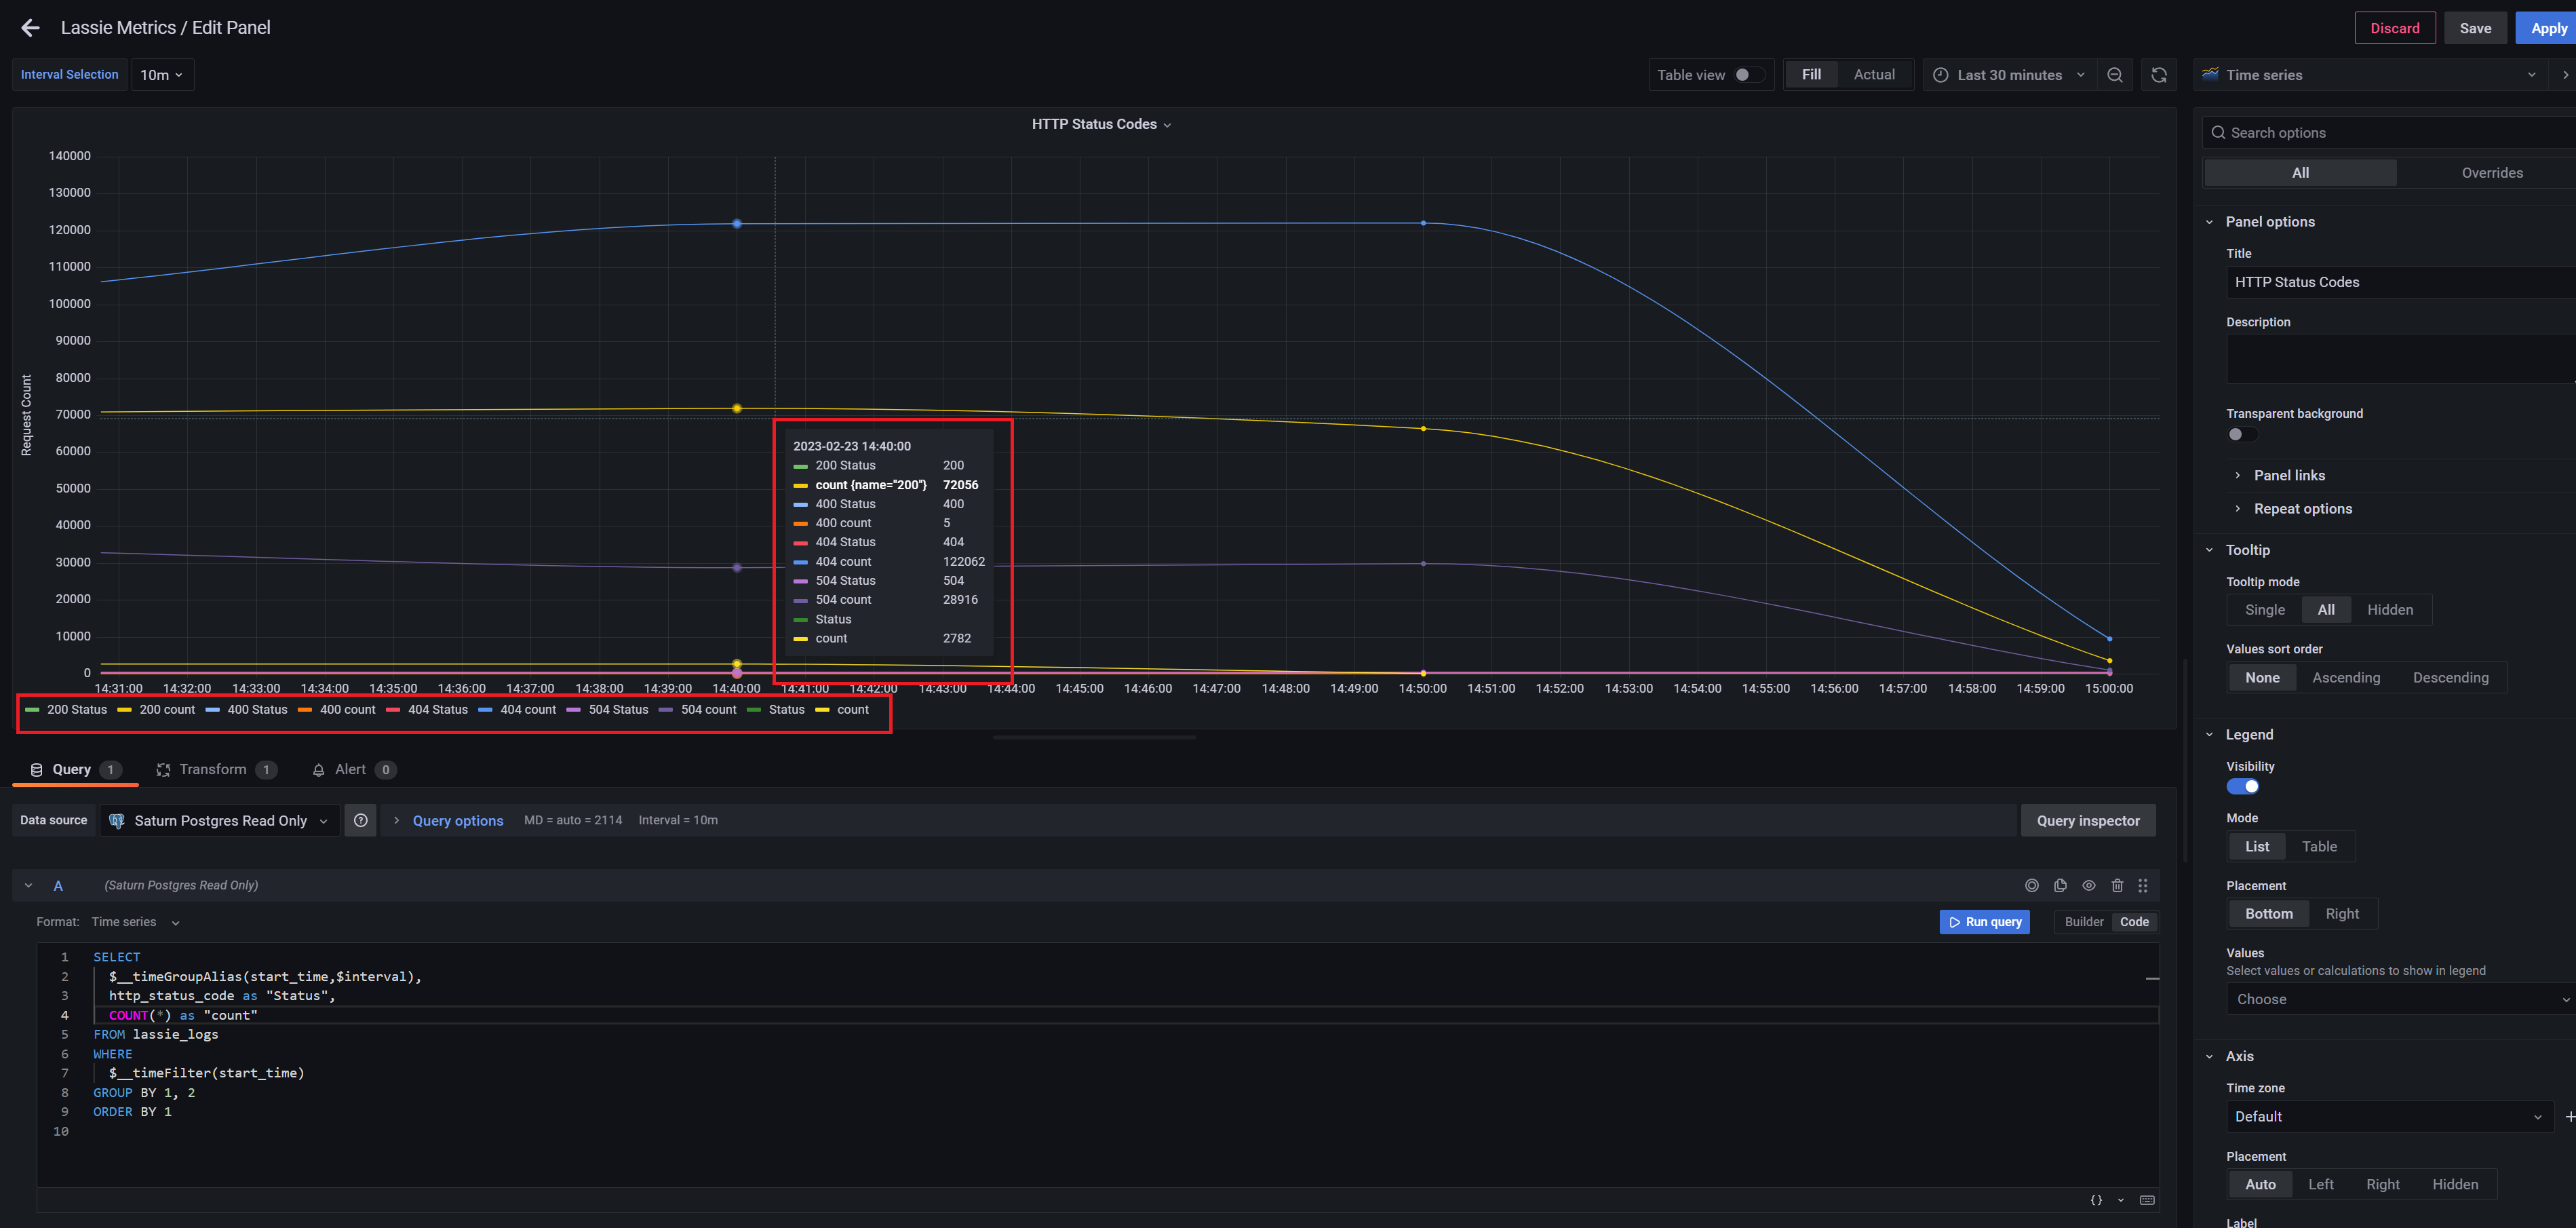
There should only be one label per status, for example:
“200 count”, “400 count”, “404 count”, etc.
but instead it has
“200 status”, “200 count”, “400 status”, “400 count”, “404 status”, “404 count”,
How do I remove these extra labels?