Origin now allowed with Nginx HTTP 3/Quic

  • What Grafana version and what operating system are you using?
  • Grafana v10.4.0
  • Ubuntu Server 20.04 (LTS)
  • What are you trying to achieve?

Just logging-in. Nothing in particular. I just want to use my Grafana instance.

  • What happened?

I’m getting a pop-up notification “origin not allowed”. Opening my Firefox network tab, it seems that https://stats.melroy.org/api/frontend-metrics call is only returning a 403 error message. With the response “origin not allowed”. See image below for more info.

EDIT: I ALSO see the same 403 error message on the https://stats.melroy.org/api/user/auth-tokens/rotate request.

  • What did you expect to happen?

No errors or warnings!

  • Can you copy/paste the configuration(s) that you are having problems with?

As you can see. YES, I do have proxy_set_header Host $http_host; configured in my Nginx server configuration. I do use HTTP/3 (QUIC).

Nginx:

map $http_upgrade $connection_upgrade {
  default upgrade;
  '' close;
}

server {
    listen 443 quic;
    listen 443 ssl;
    http2 on;
    server_name stats.melroy.org;
    
    root /var/www/stats.melroy.org/html;

    ## Removed some TLS/SSL unrelated stuff... ##

    include snippets/security.conf;
    
    index index.html index.htm;
    
    location / {
        proxy_set_header Host $http_host;
        proxy_set_header X-Forwarded-For $remote_addr;
        proxy_pass http://localhost:3002/;
    }

    # Proxy Grafana Live WebSocket connections.
    location /api/live/ws {
        rewrite  ^/(.*)  /$1 break;
        proxy_http_version 1.1;
        proxy_set_header Upgrade $http_upgrade;
        proxy_set_header Connection "Upgrade";
        proxy_set_header Host $http_host;
        proxy_pass http://localhost:3002/;
    }
}

Grafana:

[server]
# The http port  to use
http_port = 3002

# The public facing domain name used to access grafana from a browser
domain = stats.melroy.org

[live]
allowed_origins = "https://stats.melroy.org"

  • Did you receive any errors in the Grafana UI or in related logs? If so, please tell us exactly what they were.

No errors in grafana.log.

See HAR from Firefox:

  • frontend-metrics: Deleted
  • rotate: Deleted

GUI:

image

1 Like

Try tcpdump on that Grafana port 3002 to see if Grafana receives proper Host header in the request.
Is it vanilla nginx?

Yes it is the latest vanilla Nginx (nginx/1.25.4 at this moment of writing). Thus not freenginx.

I have no clue how you want to retrieve this host header information via tcpdump. This is what I tried:

sudo tcpdump -i any port 3002 -n
tcpdump: data link type LINUX_SLL2
tcpdump: verbose output suppressed, use -v[v]... for full protocol decode
listening on any, link-type LINUX_SLL2 (Linux cooked v2), snapshot length 262144 bytes
18:48:22.705580 lo    In  IP 127.0.0.1.43490 > 127.0.0.1.3002: Flags [P.], seq 3885193030:3885197134, ack 3982702858, win 11, length 4104
18:48:22.705586 lo    In  IP 127.0.0.1.43490 > 127.0.0.1.3002: Flags [P.], seq 4104:8208, ack 1, win 11, length 4104
18:48:22.705590 lo    In  IP 127.0.0.1.3002 > 127.0.0.1.43490: Flags [.], ack 4104, win 1163, length 0
18:48:22.705592 lo    In  IP 127.0.0.1.43490 > 127.0.0.1.3002: Flags [P.], seq 8208:12312, ack 1, win 11, length 4104
18:48:22.705596 lo    In  IP 127.0.0.1.3002 > 127.0.0.1.43490: Flags [.], ack 12312, win 1162, length 0
18:48:22.705601 lo    In  IP 127.0.0.1.43490 > 127.0.0.1.3002: Flags [P.], seq 12312:16416, ack 1, win 11, length 4104
18:48:22.705606 lo    In  IP 127.0.0.1.43490 > 127.0.0.1.3002: Flags [P.], seq 16416:20520, ack 1, win 11, length 4104
18:48:22.705609 lo    In  IP 127.0.0.1.3002 > 127.0.0.1.43490: Flags [.], ack 20520, win 1169, length 0
18:48:22.705614 lo    In  IP 127.0.0.1.43490 > 127.0.0.1.3002: Flags [P.], seq 20520:24624, ack 1, win 11, length 4104
18:48:22.705619 lo    In  IP 127.0.0.1.43490 > 127.0.0.1.3002: Flags [P.], seq 24624:28728, ack 1, win 11, length 4104
18:48:22.705621 lo    In  IP 127.0.0.1.3002 > 127.0.0.1.43490: Flags [.], ack 28728, win 1170, length 0
18:48:22.705626 lo    In  IP 127.0.0.1.43490 > 127.0.0.1.3002: Flags [P.], seq 28728:32832, ack 1, win 11, length 4104
18:48:22.705631 lo    In  IP 127.0.0.1.43490 > 127.0.0.1.3002: Flags [P.], seq 32832:36936, ack 1, win 11, length 4104
18:48:22.705636 lo    In  IP 127.0.0.1.43490 > 127.0.0.1.3002: Flags [P.], seq 36936:41040, ack 1, win 11, length 4104
18:48:22.705641 lo    In  IP 127.0.0.1.43490 > 127.0.0.1.3002: Flags [P.], seq 41040:45144, ack 1, win 11, length 4104
18:48:22.705650 lo    In  IP 127.0.0.1.43490 > 127.0.0.1.3002: Flags [P.], seq 45144:49248, ack 1, win 11, length 4104
18:48:22.705656 lo    In  IP 127.0.0.1.43490 > 127.0.0.1.3002: Flags [P.], seq 49248:53352, ack 1, win 11, length 4104
18:48:22.705661 lo    In  IP 127.0.0.1.43490 > 127.0.0.1.3002: Flags [P.], seq 53352:57456, ack 1, win 11, length 4104
18:48:22.705663 lo    In  IP 127.0.0.1.3002 > 127.0.0.1.43490: Flags [.], ack 53352, win 1167, length 0
18:48:22.705669 lo    In  IP 127.0.0.1.43490 > 127.0.0.1.3002: Flags [P.], seq 57456:61560, ack 1, win 11, length 4104
18:48:22.705673 lo    In  IP 127.0.0.1.3002 > 127.0.0.1.43490: Flags [.], ack 61560, win 1166, length 0
18:48:22.705674 lo    In  IP 127.0.0.1.43490 > 127.0.0.1.3002: Flags [P.], seq 61560:65664, ack 1, win 11, length 4104
18:48:22.705679 lo    In  IP 127.0.0.1.43490 > 127.0.0.1.3002: Flags [P.], seq 65664:69768, ack 1, win 11, length 4104
18:48:22.705684 lo    In  IP 127.0.0.1.3002 > 127.0.0.1.43490: Flags [.], ack 69768, win 1165, length 0
18:48:22.705684 lo    In  IP 127.0.0.1.43490 > 127.0.0.1.3002: Flags [P.], seq 69768:73872, ack 1, win 11, length 4104
18:48:22.705690 lo    In  IP 127.0.0.1.43490 > 127.0.0.1.3002: Flags [P.], seq 73872:77976, ack 1, win 11, length 4104
18:48:22.705693 lo    In  IP 127.0.0.1.3002 > 127.0.0.1.43490: Flags [.], ack 77976, win 1164, length 0
18:48:22.705697 lo    In  IP 127.0.0.1.43490 > 127.0.0.1.3002: Flags [P.], seq 77976:82080, ack 1, win 11, length 4104
18:48:22.705702 lo    In  IP 127.0.0.1.43490 > 127.0.0.1.3002: Flags [P.], seq 82080:86184, ack 1, win 11, length 4104
18:48:22.705705 lo    In  IP 127.0.0.1.3002 > 127.0.0.1.43490: Flags [.], ack 86184, win 1171, length 0
18:48:22.705710 lo    In  IP 127.0.0.1.43490 > 127.0.0.1.3002: Flags [P.], seq 86184:90288, ack 1, win 11, length 4104
18:48:22.705715 lo    In  IP 127.0.0.1.43490 > 127.0.0.1.3002: Flags [P.], seq 90288:94392, ack 1, win 11, length 4104
18:48:22.705717 lo    In  IP 127.0.0.1.3002 > 127.0.0.1.43490: Flags [.], ack 94392, win 1172, length 0
18:48:22.705722 lo    In  IP 127.0.0.1.43490 > 127.0.0.1.3002: Flags [P.], seq 94392:98496, ack 1, win 11, length 4104
18:48:22.705727 lo    In  IP 127.0.0.1.43490 > 127.0.0.1.3002: Flags [P.], seq 98496:102600, ack 1, win 11, length 4104
18:48:22.705732 lo    In  IP 127.0.0.1.43490 > 127.0.0.1.3002: Flags [P.], seq 102600:106704, ack 1, win 11, length 4104
18:48:22.705738 lo    In  IP 127.0.0.1.43490 > 127.0.0.1.3002: Flags [P.], seq 106704:110808, ack 1, win 11, length 4104
18:48:22.705747 lo    In  IP 127.0.0.1.43490 > 127.0.0.1.3002: Flags [P.], seq 110808:114912, ack 1, win 11, length 4104
18:48:22.705752 lo    In  IP 127.0.0.1.3002 > 127.0.0.1.43490: Flags [.], ack 114912, win 1169, length 0
18:48:22.705752 lo    In  IP 127.0.0.1.43490 > 127.0.0.1.3002: Flags [P.], seq 114912:119016, ack 1, win 11, length 4104
18:48:22.705757 lo    In  IP 127.0.0.1.43490 > 127.0.0.1.3002: Flags [P.], seq 119016:123120, ack 1, win 11, length 4104
18:48:22.705762 lo    In  IP 127.0.0.1.3002 > 127.0.0.1.43490: Flags [.], ack 123120, win 1170, length 0
18:48:22.705763 lo    In  IP 127.0.0.1.43490 > 127.0.0.1.3002: Flags [P.], seq 123120:127224, ack 1, win 11, length 4104
18:48:22.705769 lo    In  IP 127.0.0.1.43490 > 127.0.0.1.3002: Flags [P.], seq 127224:131328, ack 1, win 11, length 4104
18:48:22.705771 lo    In  IP 127.0.0.1.3002 > 127.0.0.1.43490: Flags [.], ack 131328, win 1170, length 0
18:48:22.705776 lo    In  IP 127.0.0.1.43490 > 127.0.0.1.3002: Flags [P.], seq 131328:135432, ack 1, win 11, length 4104
18:48:22.705782 lo    In  IP 127.0.0.1.43490 > 127.0.0.1.3002: Flags [P.], seq 135432:136325, ack 1, win 11, length 893
18:48:22.705786 lo    In  IP 127.0.0.1.3002 > 127.0.0.1.43490: Flags [.], ack 136325, win 1169, length 0
18:48:23.331467 lo    In  IP 127.0.0.1.43490 > 127.0.0.1.3002: Flags [P.], seq 136325:137168, ack 1, win 11, length 843
18:48:23.331485 lo    In  IP 127.0.0.1.3002 > 127.0.0.1.43490: Flags [.], ack 137168, win 1184, length 0

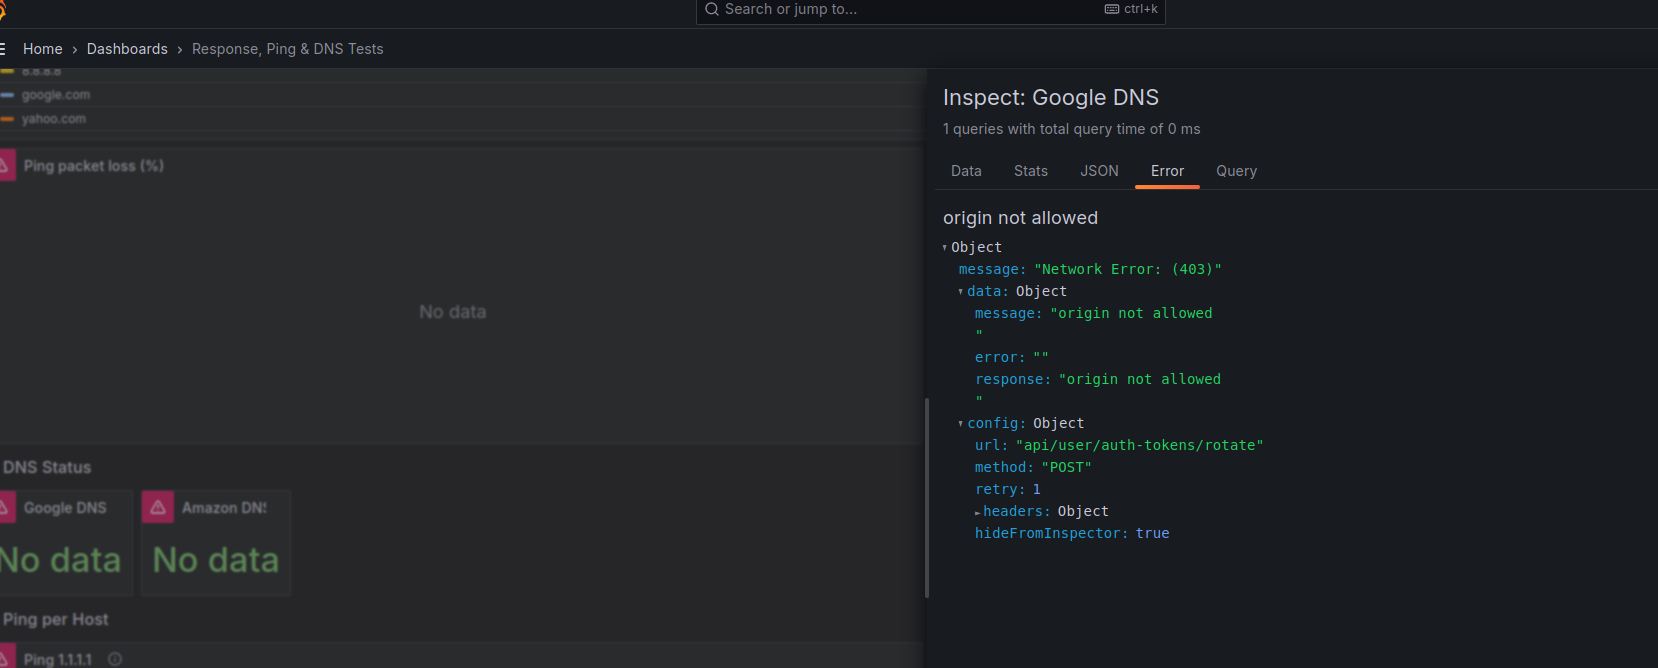
Error while using Grafana after several minutes:

I already shared my Nginx configs above.

And you should also have the HAR files from Firefox. See my first post.

https://www.tcpdump.org/manpages/tcpdump.1.html

-A
Print each packet (minus its link level header) in ASCII. Handy for capturing web pages.

1 Like

The origin header is part of the HTTP header during the POST request (and set to the correct URL). See tcpdump below:

21:45:50.343312 lo    In  IP 127.0.0.1.60354 > 127.0.0.1.3002: Flags [S], seq 1802144394, win 21845, options [mss 65495,nop,nop,sackOK,nop,wscale 11], length 0
E..4.'@.@...............kj........UU.(..............
21:45:50.343319 lo    In  IP 127.0.0.1.3002 > 127.0.0.1.60354: Flags [S.], seq 1618726799, ack 1802144395, win 21845, options [mss 65495,nop,nop,sackOK,nop,wscale 11], length 0
E..4..@.@.<.............`{..kj....UU.(..............
21:45:50.343325 lo    In  IP 127.0.0.1.60354 > 127.0.0.1.3002: Flags [.], ack 1, win 11, length 0
E..(.(@.@...............kj..`{..P.......
21:45:50.343371 lo    In  IP 127.0.0.1.60354 > 127.0.0.1.3002: Flags [P.], seq 1:1012, ack 1, win 11, length 1011
E....)@.@...............kj..`{..P.......POST /api/frontend-metrics HTTP/1.0
X-Forwarded-For: 192.168.1.102
Connection: close
Content-Length: 352
priority: u=4
user-agent: Mozilla/5.0 (X11; Linux x86_64; rv:123.0) Gecko/20100101 Firefox/123.0
accept: application/json, text/plain, */*
accept-language: en-US,en;q=0.5
accept-encoding: gzip, deflate, br
content-type: application/json
x-grafana-device-id: 7de35222334568f2c82b3945336843c9
x-grafana-org-id: 1
origin: https://stats.melroy.org
alt-used: stats.melroy.org
sec-fetch-dest: empty
sec-fetch-mode: cors
sec-fetch-site: same-origin
cookie: grafana_session=1989cd4e140b3df2951f150c21b2873f; grafana_session_expiry=1710276844

{"events":[{"name":"frontend_plugins_preload_ms","value":0},{"name":"frontend_app_init_ms","value":42},{"name":"frontend_boot_first_contentful_paint_time_seconds","value":0.604},{"name":"frontend_boot_load_time_seconds","value":0.666},{"name":"frontend_boot_js_done_time_seconds","value":0.574},{"name":"frontend_boot_css_time_seconds","value":0.172}]}
21:45:50.343378 lo    In  IP 127.0.0.1.3002 > 127.0.0.1.60354: Flags [.], ack 1012, win 11, length 0
E..(..@.@.Z.............`{..kj.~P.......
21:45:50.343574 lo    In  IP 127.0.0.1.3002 > 127.0.0.1.60354: Flags [P.], seq 1:177, ack 1012, win 11, length 176
E.....@.@.Y`............`{..kj.~P.......HTTP/1.0 403 Forbidden
Content-Type: text/plain; charset=utf-8
X-Content-Type-Options: nosniff
Date: Tue, 12 Mar 2024 20:45:50 GMT
Content-Length: 19

origin not allowed

21:45:50.343583 lo    In  IP 127.0.0.1.60354 > 127.0.0.1.3002: Flags [.], ack 177, win 11, length 0
E..(.*@.@...............kj.~`{.@P.......
21:45:50.343597 lo    In  IP 127.0.0.1.3002 > 127.0.0.1.60354: Flags [F.], seq 177, ack 1012, win 11, length 0
E..(..@.@.Z.............`{.@kj.~P.......
21:45:50.343625 lo    In  IP 127.0.0.1.60354 > 127.0.0.1.3002: Flags [F.], seq 1012, ack 178, win 11, length 0
E..(.+@.@...............kj.~`{.AP.......
21:45:50.343635 lo    In  IP 127.0.0.1.3002 > 127.0.0.1.60354: Flags [.], ack 1013, win 11, length 0
E..(..@.@.Z.............`{.Akj..P.......
21:45:51.100517 lo    In  IP 127.0.0.1.43490 > 127.0.0.1.3002: Flags [P.], seq 1631502:1635606, ack 3, win 11, length 4104

Grafana returns 403 error with the body: “origin not allowed”.

Origin I set in grafana.ini is indeed: allowed_origins = "https://stats.melroy.org".

However, the Host header seems indeed be missing in the output above. Despite I set those proxy headers via Nginx:

    location / {
        proxy_set_header Host $http_host;
        proxy_set_header X-Forwarded-For $remote_addr;
        proxy_pass http://localhost:3002/;
    }

    # Proxy Grafana Live WebSocket connections.
    location /api/live/ws {
        rewrite  ^/(.*)  /$1 break;
        proxy_http_version 1.1;
        proxy_set_header Upgrade $http_upgrade;
        proxy_set_header Connection "Upgrade";
        proxy_set_header Host $http_host;
        proxy_pass http://localhost:3002/;
    }

Could it because I’m using HTTP/3/Quic?

Correct, you proved that Nginx is not sending Host header, so blame Nginx, not Grafana (Nginx forum is better now for this issue, not Grafana).
I would say HTTP 3 is still bleeding edge, so you can expect issues.

1 Like

OK. So I disabled HTTP/3 / Quic support in Nginx. See tcpdump of that:

E....	@.@...............L..(.y..P.......POST /api/frontend-metrics HTTP/1.0
Host: stats.melroy.org
X-Forwarded-For: 192.168.1.102
Connection: close
Content-Length: 352
user-agent: Mozilla/5.0 (X11; Linux x86_64; rv:123.0) Gecko/20100101 Firefox/123.0
accept: application/json, text/plain, */*
accept-language: en-US,en;q=0.5
accept-encoding: gzip, deflate, br
content-type: application/json
x-grafana-device-id: 7de35222334568f2c82b3945336843c9
x-grafana-org-id: 1
origin: https://stats.melroy.org
sec-fetch-dest: empty
sec-fetch-mode: cors
sec-fetch-site: same-origin
cookie: grafana_session=dcefa9ab44a2a945d3beb5fd05e17c69; grafana_session_expiry=1710277726

{"events":[{"name":"frontend_plugins_preload_ms","value":0},{"name":"frontend_app_init_ms","value":129},{"name":"frontend_boot_first_contentful_paint_time_seconds","value":0.457},{"name":"frontend_boot_load_time_seconds","value":1.44},{"name":"frontend_boot_js_done_time_seconds","value":1.121},{"name":"frontend_boot_css_time_seconds","value":0.231}]}
22:02:18.694952 lo    In  IP 127.0.0.1.3002 > 127.0.0.1.48512: Flags [.], ack 993, win 11, length 0
E..(..@.@.b..............y..L...P.......
22:02:18.696494 lo    In  IP 127.0.0.1.3002 > 127.0.0.1.48512: Flags [P.], seq 1:190, ack 993, win 11, length 189
E.....@.@.b/.............y..L...P.......HTTP/1.0 200 OK
Cache-Control: no-store
X-Content-Type-Options: nosniff
X-Frame-Options: deny
X-Xss-Protection: 1; mode=block
Date: Tue, 12 Mar 2024 21:02:18 GMT
Content-Length: 0

Now Grafana API works again:

So it seems be Quic related indeed. And the host is not getting forwarded. I do blame Nginx for this indeed. Thanks for you time!!

1 Like

https://trac.nginx.org/nginx/ticket/2281

Curl translates -H ‘host: localhost’ into the ‘:authority’ pseudo-header.
In contrary, $http_host contains the “Host” request header field, which isn’t seemingly sent by Curl (but it could).
If you still need something that contains the authority component, use $host.

2 Likes

Actually maybe it’s Grafana documentation related… Nginx should not use $http_host instead use $host. So maybe the documentation needs to be updated.

https://trac.nginx.org/nginx/ticket/2468#comment:1

EDIT: Lol, I think we found the same root-cause… Could you inform the docs people?

Sorry, I’m not Grafana employee. Feel free to use “Report a problem” link in the doc.

1 Like

I sent them an email. Thanks again for your time and support!

EDIT: I can btw confirm that changing $http_host to $host solved my issue!

1 Like