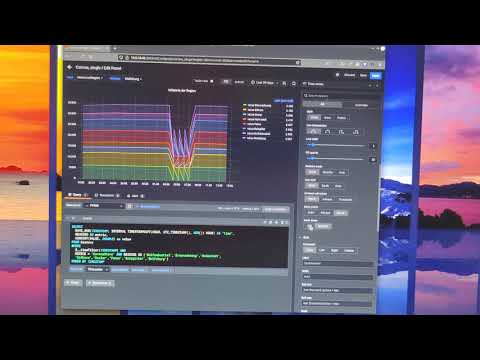
Here’s a simplified postgres query of what kind of results we get. As you can see, the data has gaps, but that’s fine since each time period doesn’t have every event.
select *
from ( VALUES
	(timestamp '2020-01-01 00:01', 'a', 2),
	('2020-01-01 00:01', 'b', 1),
	('2020-01-01 00:02', 'a', 2),
	('2020-01-01 00:03', 'a', 2),
	('2020-01-01 00:03', 'b', 1),
	('2020-01-01 00:03', 'c', 1),
	('2020-01-01 00:04', 'a', 2)
) t("time", "metric", "value");
The problem comes in when we graph it using Grafana (stacked):
Some examples of the errors:
-
The point at
:02should be 2, sinceais the only one in that time-group, but it’s being displayed as 3. -
The hover legend for that point is showing a total of 4, which is also incorrect.
Changing Null value between null, null as zero, and connected doesn’t seem to do anything. They all seem to behave like connected. It even seems to backfill, showing c before it’s first value.
I would expect null as zero to act like a zerofill for the values. Am I wrong in that assumption?
Here’s what we would like it to look like (emulating zerofill using the DB, but this can be tricky depending on the query):
select *
from ( VALUES
	(timestamp '2020-01-01 00:01', 'a', 2),
	('2020-01-01 00:01', 'b', 1),
	('2020-01-01 00:01', 'c', 0),
	('2020-01-01 00:02', 'a', 2),
	('2020-01-01 00:02', 'b', 0),
	('2020-01-01 00:02', 'c', 0),
	('2020-01-01 00:03', 'a', 2),
	('2020-01-01 00:03', 'b', 1),
	('2020-01-01 00:03', 'c', 1),
	('2020-01-01 00:04', 'a', 2),
	('2020-01-01 00:04', 'b', 0),
	('2020-01-01 00:04', 'c', 0)
) s("time", "metric", "value");


