xbslick
November 19, 2017, 12:29pm
1
Hello! My name is Pavel, I’m from Ukraine, Kiev.
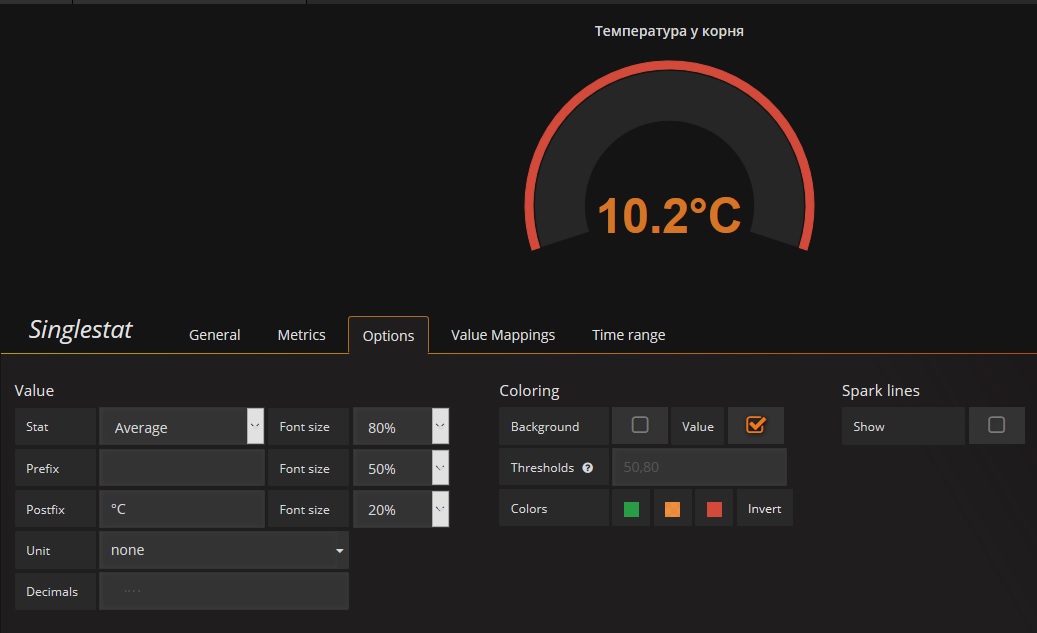
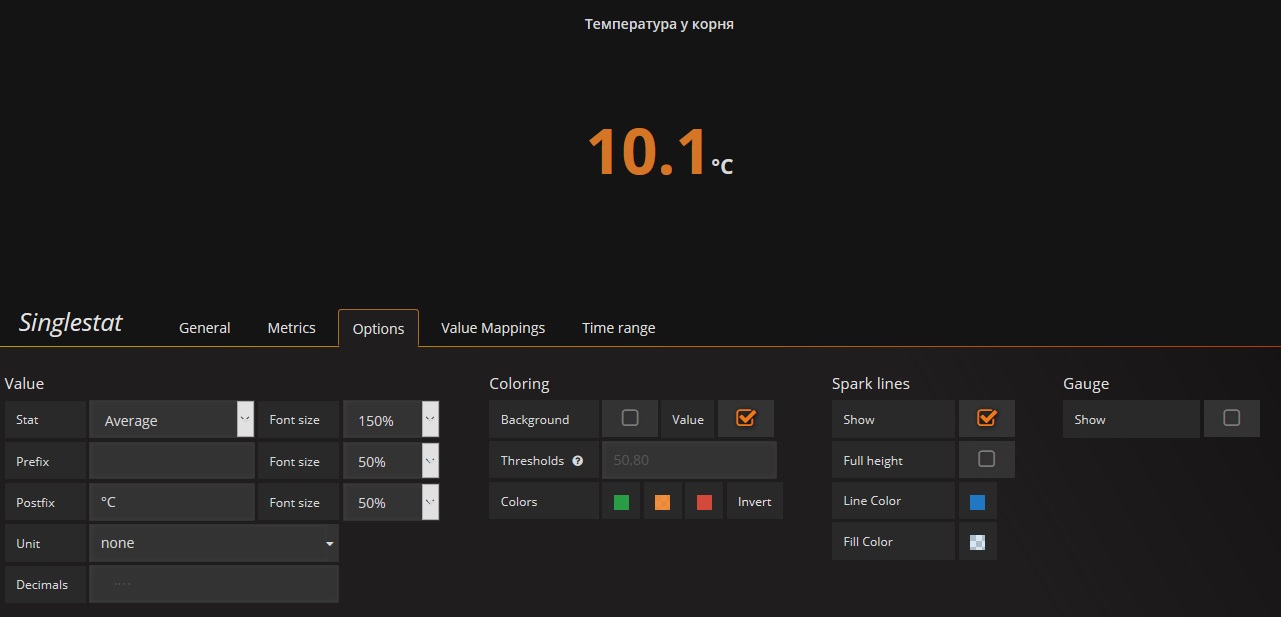
The Gauge function. I choose the necessary check, but the Gauge does not move.
Spark lines don’t work too.
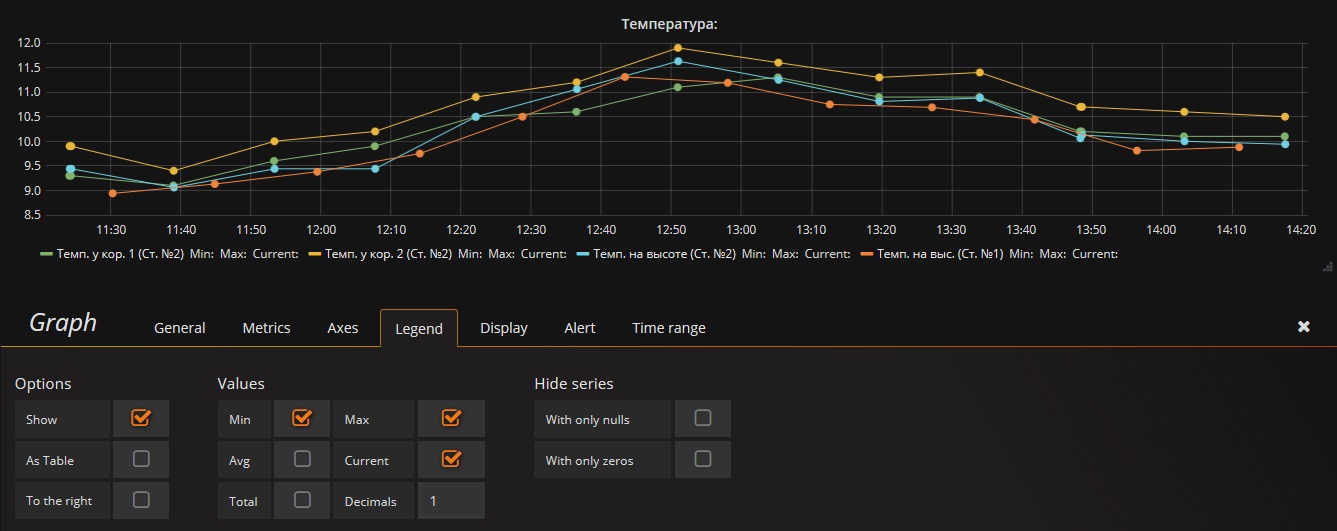
“Min, Max, Curent” functions on the graph not displayed.
Grafana version: 4.6.1
P.S. How to calculate and display the average arithmetic value, based on the readings of eight temperature sensors?
xbslick
December 30, 2017, 4:52pm
3
Any advice? What’s wrong with the settings?
Hi,
I have exactly the same issue. It seems to be more a bug then a misconfiguration.
Two other setting are not working:
Background Color or Text Font Color don’t match the color of the Thresholds settings
Font size doesn’t seems to work too. Prefix or Postfix text have the same size then Stat text Font Size
Actually used configuration:
Grafana version: Version 4.6.3 (commit: 7a06a47)#893 SMP Wed Jun 8 14:39:18 BST 2016 armv7l GNU/Linux
Regards from Luxembourg, Eric
I have the same issue, any thoughts? anyone?
i have the same issue
the Arduino Humidity and the Arduino Temperature not working#1159 SMP Sun Nov 4 17:50:20 GMT 2018 armv7l GNU/Linux