Dear community,
As you know, there is no published datasource plugin for Nodegraph panel of Grafana except for Xray which is commercial and only related to AWS. Accordingly, I’ve published a simple datasource plugin for this panel which connects to your designed API and visualizes the graph. You can find more details here: GitHub - hoptical/nodegraph-api-plugin: A data source plugin for nodegraph panel in grafana
I’ll appreciate it if you check it out and give me feedback or even contribute to it.

This is kinda cool but also very limited since the only config options used is the arc colour, and the colours are hard-coded to green and red. What if I need more than 2 arcs? What if I want to provide a human-readable label for the various stats?
As the plugin stands I believe all database datasource plugin could do the same thing…
It sounds like you’re referring to the node graph itself, which is a built-in visualization. @hamedkarbasi93 would have to confirm, but I believe the purpose of this plugin is to integrate the node graph with your own REST API. In a way, it’s an adapter for those who prefer to build a web service rather than a data source plugin.
@glep207 Thanks for your feedback. As @marcusolsson said, it’s only as a layer between your REST API and the node graph. But you’re right about the limitation. The ability to add various stats, different colors and detail labels will be added in the next version, which will be released too soon.
v0.3.0 is released now. The limitation discussed above is resolved, and the user can customize his desirable parameters via API.
Hello Sir, This is great! Just what we need to graph our saga orders process. We are using containers and the Grafana container image. How would you add it into a Grafana container? I guess put it in the Docker Compose grafana service volumes folder?
grafana:
image: grafana/grafana-oss
networks:
- “SlideX”
ports:
- “3000:3000”
volumes:
- ./grafana/plugin/exaco/[some kind of files]:/etc/grafana/plugins
Do you just add the plugin as you have the folder structure?
Also do I specify the signing as an environment variable?
Your docs are a little unclear. Sorry but you gotta cool app there!
Also is there a refresh built in to your plugin? If so how do we configure it?
Hi. Glad to hear that.
To utilize the plugin, you should:
- Download the release zip file.
- extract it in a folder named:
grafana-plugins - Use the below docker-compose:
version: '3'
services:
        grafana:
            image: grafana/grafana:8.3.3
            container_name: mygrafana
            volumes:
                    - ./grafana-plugins:/var/lib/grafana/plugins:rw
            environment:
                    - GF_PLUGINS_ALLOW_LOADING_UNSIGNED_PLUGINS=hamedkarbasi93-nodegraphapi-datasource
            ports:
                    - "3000:3000"
As you can see, you’ve to use both volume and singing as the environment variable.
I didn’t understand what you mean by refresh. Explain more, please.
Thanks so much. I was just researching and you clarified everything! Oh the refresh I think is built into the Grafana platform.
Ok all its setup and testing shows getting connection error.
My api data is below and works fine. I am all in localhost so no remote server.
Can you add a CORS header with the below setting? I have disabled CORS for community.grafana.com on the web api.
If an opaque response serves your needs, set the request’s mode to ‘no-cors’ to fetch the resource with CORS disabled
data from API GET below:
{“edges”:[
{“id”:“1”,“mainStat”:“53/s”,“source”:“1”,“target”:“2”}],
“nodes”:[{“arc__failed”:0.7,“arc__passed”:0.3,“detail__zone”:“load”,“id”:“1”,“subTitle”:“instance:#2”,“title”:“service1”},{“arc__failed”:0.5,“arc__passed”:0.5,“detail__zone”:“transform”,“id”:“2”,“subTitle”:“instance:#3”,“title”:“service2”}]}
browser script error
Access to fetch at ‘http://localhost:5021/nodes/api/health’ from origin ‘http://grafana.staged-by-discourse.com’ has been blocked by CORS policy: No ‘Access-Control-Allow-Origin’ header is present on the requested resource. If an opaque response serves your needs, set the request’s mode to ‘no-cors’ to fetch the resource with CORS disabled
error screen in Grafana

Here is my docker compose
grafana:
image: grafana/grafana:8.3.3
container_name: grafana
networks:
- “SlideX”
ports:
- “3000:3000”
volumes:
- ./grafana/dashboards.yml:/etc/grafana/provisioning/dashboards/rabbitmq.yaml
- ./grafana/datasources.yml:/etc/grafana/provisioning/datasources/prometheus.yaml
- ./grafana/dashboards:/dashboards
- ./grafana-plugins:/var/lib/grafana/plugins:rw
environment:
- GF_PLUGINS_ALLOW_LOADING_UNSIGNED_PLUGINS=hamedkarbasi93-nodegraphapi-datasource
Yes it driving me crazy LOL. I am using .NET 5 and of course a .NET CORE app. I have added a CORS policy that allows grafana on port 3000 to call the GET in my controller.
Here is my config in startup.cs
app.UseCors(builder => builder.WithOrigins("http://grafana.staged-by-discourse.com")
                              .AllowAnyMethod()
                              .AllowAnyHeader());
It’s weird that you’re facing CORS issue if it’s disabled on your API server.
I’d tested the plugin with disabled CORS in this flask API and it worked. What’s your framework?
@marcusolsson any suggestion?
ok got the api connection to succeed! had to disable CORS in the browser.
Thanks
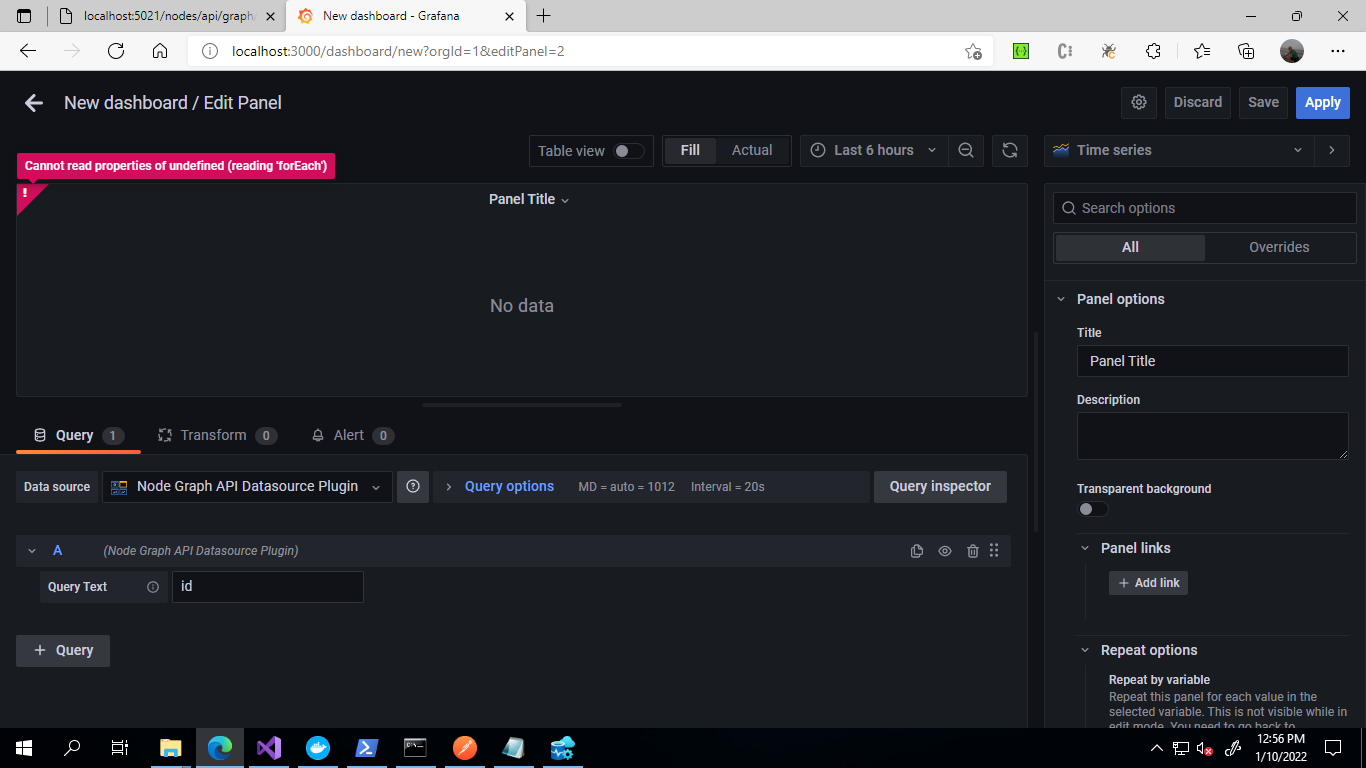
Hello again. All is connecting now and I have my 3 api calls for api/health, api.graph/data and api/graph/fields but I am getting the following errors on my graph.
However I am getting the error:
Cannot read properties of undefined (reading ‘forEach’)
and
TypeError: Cannot read properties of undefined (reading ‘forEach’)
at e (:3000/public/plugins/hamedkarbasi93-nodegraphapi-datasource/module.js:2:10855)
at eval (:3000/public/plugins/hamedkarbasi93-nodegraphapi-datasource/module.js:2:11433)
at eval (:3000/public/plugins/hamedkarbasi93-nodegraphapi-datasource/module.js:2:10363)
at Object.eval [as next] (:3000/public/plugins/hamedkarbasi93-nodegraphapi-datasource/module.js:2:10468)
at u (:3000/public/plugins/hamedkarbasi93-nodegraphapi-datasource/module.js:2:9207)
(anonymous) @ runRequest.ts:146
see screen shots below

Send output jsons of the api for graph/fields and graph/data endpoints here.
api/graph/fields
{“edges_fields”: [{“field_name”: “id”,“type”: “string”},{“field_name”: “source”,“type”: “string”},{“field_name”: “target”,“type”: “string”},{“field_name”: “mainStat”,“type”: “number”}],“nodes_fields”: [{“field_name”: “id”,“type”: “string”},{“field_name”: “title”,“type”: “string”},{“field_name”: “mainStat”,“type”: “string”},{“field_name”: “secondaryStat”,“type”: “number”},{“color”: “red”,“field_name”: “arc__failed”,“type”: “number”},{“color”: “green”,“field_name”: “arc__passed”,“type”: “number”},{“displayName”: “Role”,“field_name”: “detail__role”,“type”: “string”}]}
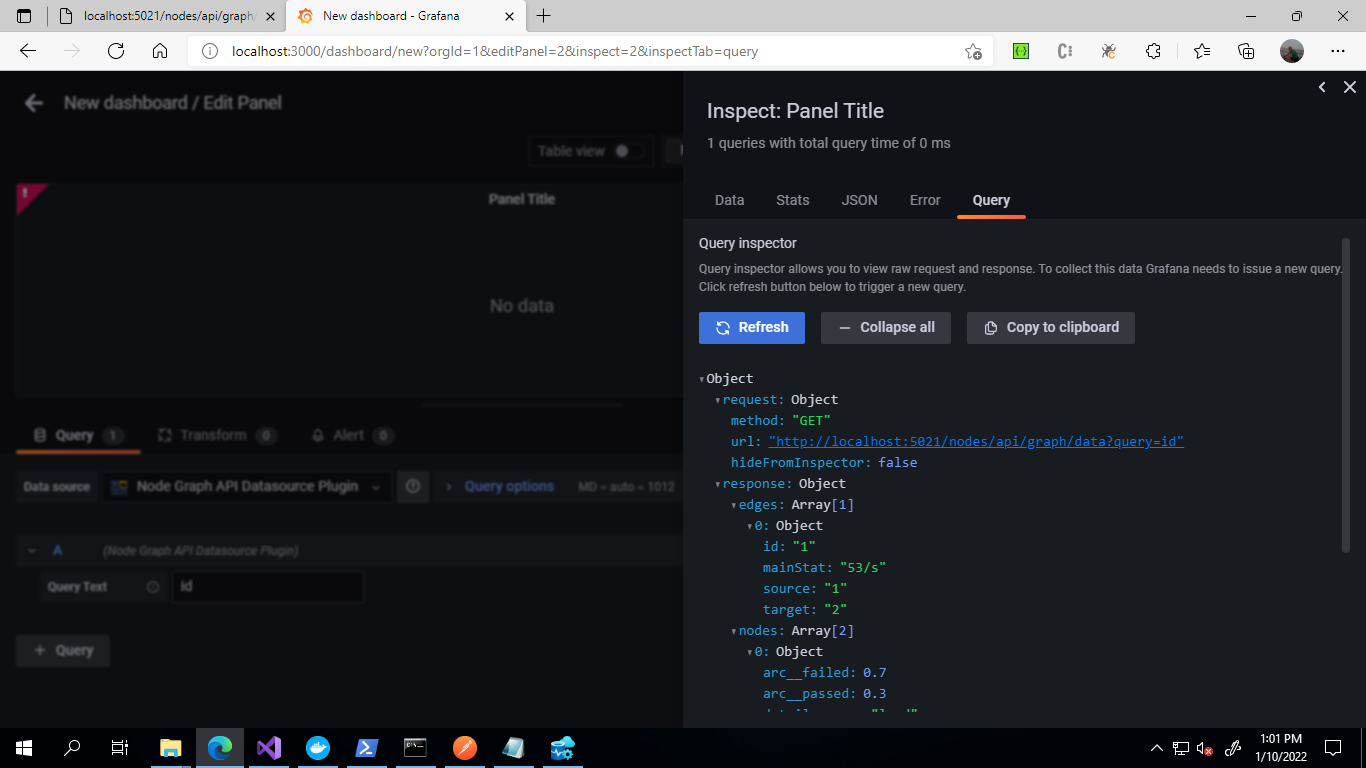
api/graph/data
{“edges”:[{“id”:“1”,“mainStat”:“53/s”,“source”:“1”,“target”:“2”}],“nodes”:[{“arc__failed”:0.7,“arc__passed”:0.3,“detail__zone”:“load”,“id”:“1”,“subTitle”:“instance:#2”,“title”:“service1”},{“arc__failed”:0.5,“arc__passed”:0.5,“detail__zone”:“transform”,“id”:“2”,“subTitle”:“instance:#3”,“title”:“service2”}]}

Hello if I want to create the data source as part of the yml file and there is a field called type required in the yml. What would I list as the type for your datasource?
Ok its hamedkarbasi93-nodegraphapi-datasource I figured it out. So type = hamedkarbasi93-nodegraphapi-datasource
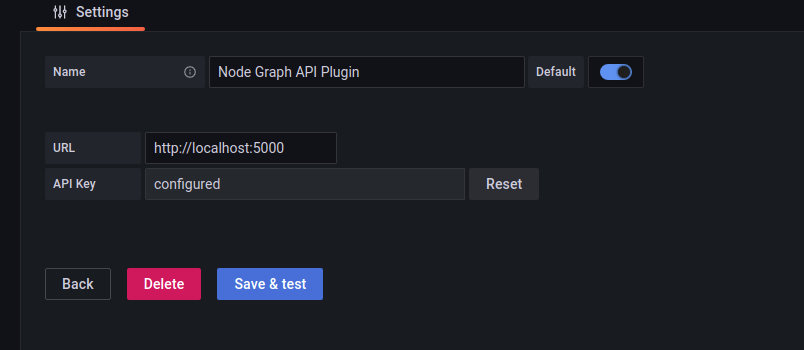
Thanks for providing this great tool @hamedkarbasi93! May I ask what would be the API key for connecting to a neo4j DB with username=‘neo4j’ & password=‘neo4j’? Many Thanks!
@alanyilun Thanks,
Currently, the API key field is not connected to the data source. So it’s not functional. Please feel free to open a feature request issue if you suggest sending additional desired information to the API server, including credentials(such as the username & password you mentioned). We’ll discuss it there and soonly consider developing the feature.