Env:
-
ubuntu 16.04
-
influxdb: 1.4.2.1
-
telegraf: 1.5.2.1
-
grafana: 5.0.0
-
telegraf collect interval is: 2 seconds
-
grafana $__interval is: 2 seconds.
-
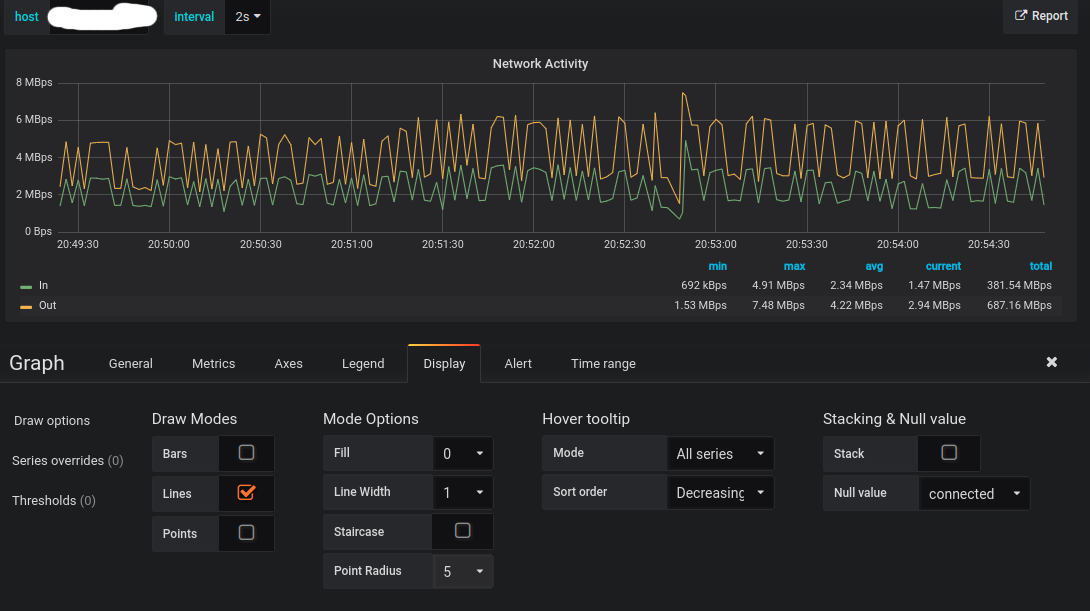
Stackin/null value / Null value is set to : null
-
in the ‘group by’ query, fill null is set.
There are no holes in influxdb data, every 2 seconds there is really data.
When changing time interval (in fact, when zooming out time range) , graph finally disappear . It comes back only if i set “null connected”
I don’t want to set to ‘connected’ because it graphes all the time, even if there is a telegraf problem (no collect).

So how to understand that?
Regards.