-
What Grafana version and what operating system are you using?
Grafana v10.0.3 (eb8dd72637) in a docker container -
What are you trying to achieve?
I would like to display “energy_yesterday” from Tasmota device even if there was no entry yesterday (instead it was a few days ago). -
How are you trying to achieve it?
My Setup: I have a few tasmota devices (power sockets with switch and energy monitor) sending status via MQTT if there is a change (power, switch) to the Tasmota Integration in Home Assistant. Or if there is no change in the status every 5 min. This Tasmota Integration send the changes to InfluxDB. But only if there is a change, not the 5 min intervall.
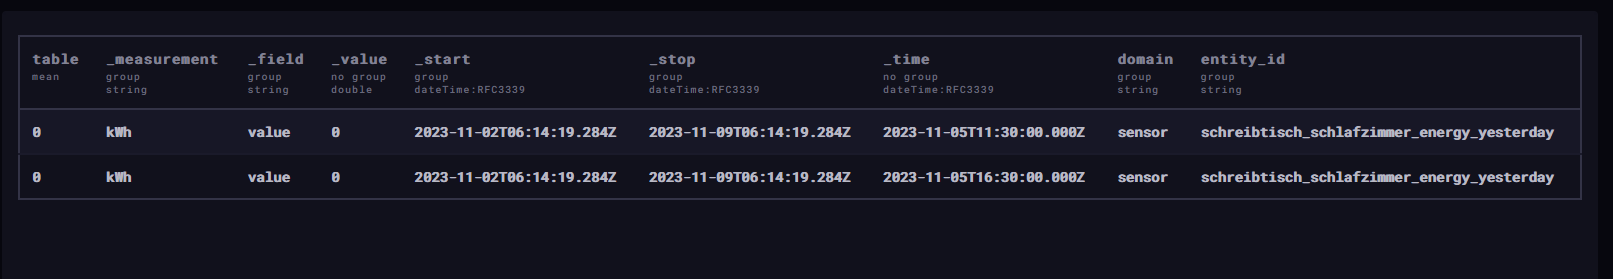
In the picture you can see the last entry in InfluxDB is saved 4 days ago. Since then the device was not in use:
Here a logfile from a similar device (different name) but you can see the 5 min interval sending MQTT data without usage of the device:
10:36:08.417 MQT: tele/tasmota_17DA0A/SENSOR = {"Time":"2023-11-09T10:36:08","ENERGY":{"TotalStartTime":"2023-04-23T12:38:39","Total":7.566,"Yesterday":0.012,"Today":0.027,"Period":0,"Power":0,"ApparentPower":0,"ReactivePower":0,"Factor":0.00,"Voltage":0,"Current":0.000}}
10:41:08.431 MQT: tele/tasmota_17DA0A/SENSOR = {"Time":"2023-11-09T10:41:08","ENERGY":{"TotalStartTime":"2023-04-23T12:38:39","Total":7.566,"Yesterday":0.012,"Today":0.027,"Period":0,"Power":0,"ApparentPower":0,"ReactivePower":0,"Factor":0.00,"Voltage":0,"Current":0.000}}
10:46:08.416 MQT: tele/tasmota_17DA0A/SENSOR = {"Time":"2023-11-09T10:46:08","ENERGY":{"TotalStartTime":"2023-04-23T12:38:39","Total":7.566,"Yesterday":0.012,"Today":0.027,"Period":0,"Power":0,"ApparentPower":0,"ReactivePower":0,"Factor":0.00,"Voltage":0,"Current":0.000}}
- What happened?
If I check the Grafana dashboard today (09.11.2023) I get a “no data”, because in my query is a time range defined (Today so far).

-
What did you expect to happen?
I expect that Grafana is showing “0” (zero) for yesterday. -
Can you copy/paste the configuration(s) that you are having problems with?
Here are my Grafana query:
from(bucket: "home_assistant")
  |> range(start: v.timeRangeStart, stop: v.timeRangeStop)
  |> filter(fn: (r) => r["entity_id"] == "schreibtisch_schlafzimmer_energy_yesterday")
  |> filter(fn: (r) => r["_measurement"] == "kWh")
  |> filter(fn: (r) => r["_field"] == "value")
  |> aggregateWindow(every: v.windowPeriod, fn: mean, createEmpty: false)
  |> yield(name: "mean")
- Did you receive any errors in the Grafana UI or in related logs? If so, please tell us exactly what they were.
No.
- Did you follow any online instructions? If so, what is the URL?
No successful result with my google search.


