Hi all, maybe someone has encountered the problem that with the connected source prometheus in grafane no data on charts, but if you use manual queries in templates (template number 11074) queries are performed correctly (Query inspector) but still no visualization, why no data on charts? using prometheus and nodeexporter.
my config prometeus
global:
scrape_interval: 15s
scrape_timeout: 10s
evaluation_interval: 15s
scrape_configs:
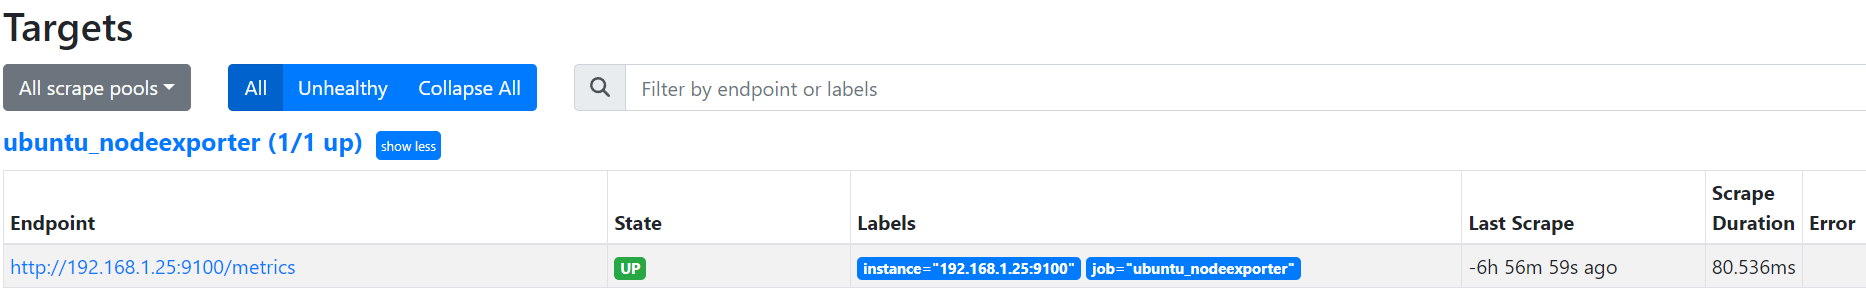
- job_name: ubuntu_nodeexporter
honor_timestamps: true
scrape_interval: 5s
scrape_timeout: 5s
metrics_path: /metrics
scheme: http
follow_redirects: true
enable_http2: true
static_configs:
- targets:
- 192.168.1.25:9100