Hello i am new to Grafana.
I installed Grafana on a Server with Zabbix Server. I grab with the zabbix plugin the data from the zabbix server and all configured hosts on it.
One interesting thing for me is, network monitoring.
I have a question how i do this correct, do i add the metric in the AXE as ‘short’ or as ‘Megabyte’?

i ask because grafana shows metrics with suspect values
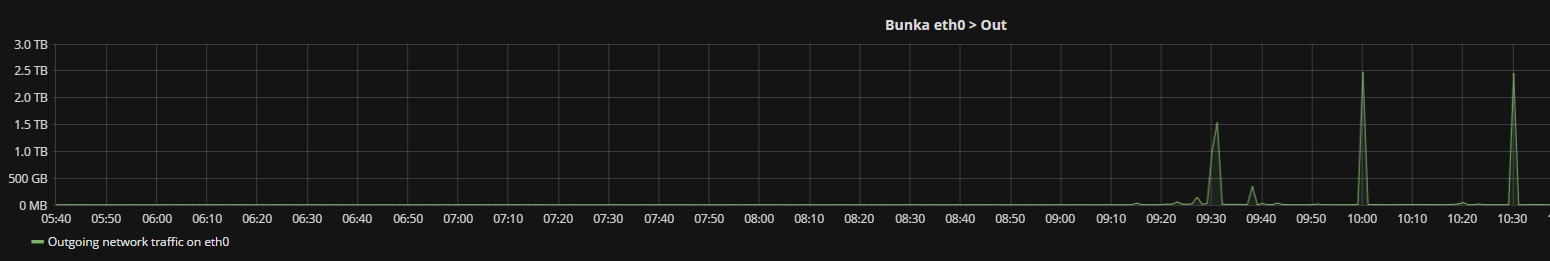
this values cant be right…
because on server vnstat shows
     day         rx      |     tx      |    total    |   avg. rate
 ------------------------+-------------+-------------+---------------

  05/05/17    192.12 MiB |  573.31 MiB |  765.43 MiB |  146.78 kbit/s
 ------------------------+-------------+-------------+---------------
 estimated       379 MiB |    1.10 GiB |    1.47 GiB |
look there at the 05/05/17