Hi,
I’m using Grafana 9.5.5 (but I also tried this on 10.0.1)
I have documents in elasticsearch which contain a nested property “data” with an array of objects. In short, I’d like to be able to work with those objects as if they were sub-documents. Meaning, create statistics on one of the fields (for example data.documents), while filtering or grouping on another property (data.serverId)
Here is an example of the document I pushed into elasticsearch:
{
“_index”: “my-index-000002”,
“_id”: “3p_taIkBZoWwDWIU8ZAh”,
“_score”: 1,
“_source”: {
“reportingTimestamp”: “2023-06-27T06:35:43.1699003”,
“collectionTimestamp”: “2023-06-27T06:35:43.1699003”,
“correlationID”: “29f5d46d-60e0-42d9-8ca4-5484c1080ecc”,
“entity”: “MyEntity”,
“data”: [
{
“changeID”: “1001”,
“commitStatus”: “Committed”,
“dBOperationType”: “Update”,
“batch”: 20,
“documents”: 3,
“serverId”: 1
},
{
“changeID”: “1002”,
“commitStatus”: “Uncommitted”,
“dBOperationType”: “Update”,
“batchNumber”: 20,
“documents”: 5,
“serverId”: 2
}
]
}
}
Property data is set to be nested in elasticsearch:
…
“data”: {
“type”: “nested”,
“properties”: {
“batch”: {
…
When I try to get plain raw logs with the following expression:

I get the following results (seems fine to me):
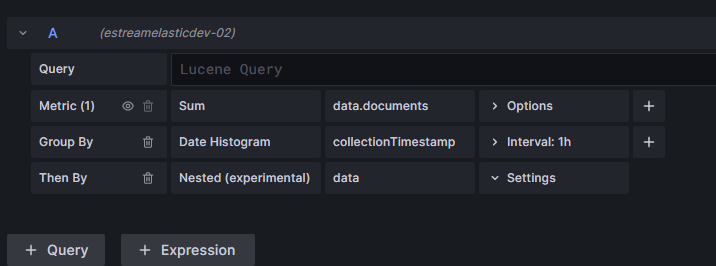
However, when I try to do a sum of a nested field (like this):
I get “No data” in the table view. However! And this is where it gets strange. When I inspect the query, I actually see nested aggregated values inside of it:
{
“request”: {
“url”: “api/datasources/proxy/uid/cb4bfb6e-5d83-4546-b47e-8a453a32b518/_msearch?max_concurrent_shard_requests=5”,
“method”: “POST”,
“data”: “{"search_type":"query_then_fetch","ignore_unavailable":true,"index":"my-index-000002"}\n{"size":0,"query":{"bool":{"filter":[{"range":{"collectionTimestamp":{"gte":1687842000000,"lte":1687849200000,"format":"epoch_millis"}}}]}},"aggs":{"3":{"date_histogram":{"field":"collectionTimestamp","min_doc_count":"0","extended_bounds":{"min":1687842000000,"max":1687849200000},"format":"epoch_millis","fixed_interval":"1h"},"aggs":{"2":{"nested":{"path":"data"},"aggs":{"1":{"sum":{"field":"data.documents"}}}}}}}}\n”,
“hideFromInspector”: false
},
“response”: {
“took”: 1,
“responses”: [
{
“took”: 1,
“timed_out”: false,
“_shards”: {
“total”: 1,
“successful”: 1,
“skipped”: 0,
“failed”: 0
},
“hits”: {
“total”: {
“value”: 1,
“relation”: “eq”
},
“max_score”: null,
“hits”:
},
“aggregations”: {
“3”: {
“buckets”: [
{
“2”: {
“1”: {
“value”: 0
},
“doc_count”: 0
},
“key_as_string”: “1687842000000”,
“key”: 1687842000000,
“doc_count”: 0
},
{
“2”: {
“1”: {
“value”: 8
},
“doc_count”: 2
},
“key_as_string”: “1687845600000”,
“key”: 1687845600000,
“doc_count”: 1
},
{
“2”: {
“1”: {
“value”: 0
},
“doc_count”: 0
},
“key_as_string”: “1687849200000”,
“key”: 1687849200000,
“doc_count”: 0
}
]
}
},
“status”: 200
}
],
“$$config”: {
“url”: “api/datasources/proxy/uid/cb4bfb6e-5d83-4546-b47e-8a453a32b518/_msearch?max_concurrent_shard_requests=5”,
“method”: “POST”,
“data”: “{"search_type":"query_then_fetch","ignore_unavailable":true,"index":"my-index-000002"}\n{"size":0,"query":{"bool":{"filter":[{"range":{"collectionTimestamp":{"gte":1687842000000,"lte":1687849200000,"format":"epoch_millis"}}}]}},"aggs":{"3":{"date_histogram":{"field":"collectionTimestamp","min_doc_count":"0","extended_bounds":{"min":1687842000000,"max":1687849200000},"format":"epoch_millis","fixed_interval":"1h"},"aggs":{"2":{"nested":{"path":"data"},"aggs":{"1":{"sum":{"field":"data.documents"}}}}}}}}\n”,
“hideFromInspector”: false
}
}
}
Same thing happens no matter what I do. I have a query to also filter out to only use serverId:1:
I still get “No data” in the table view, however, the query inspector shows the information:
{
“request”: {
“url”: “api/datasources/proxy/uid/cb4bfb6e-5d83-4546-b47e-8a453a32b518/_msearch?max_concurrent_shard_requests=5”,
“method”: “POST”,
“data”: “{"search_type":"query_then_fetch","ignore_unavailable":true,"index":"my-index-000002"}\n{"size":0,"query":{"bool":{"filter":[{"range":{"collectionTimestamp":{"gte":1687842000000,"lte":1687849200000,"format":"epoch_millis"}}}]}},"aggs":{"3":{"date_histogram":{"field":"collectionTimestamp","min_doc_count":"0","extended_bounds":{"min":1687842000000,"max":1687849200000},"format":"epoch_millis","fixed_interval":"1h"},"aggs":{"4":{"nested":{"path":"data"},"aggs":{"5":{"filters":{"filters":{"data.serverId:1":{"query_string":{"query":"data.serverId:1","analyze_wildcard":true}}}},"aggs":{"1":{"sum":{"field":"data.documents"}}}}}}}}}}\n”,
“hideFromInspector”: false
},
“response”: {
“took”: 2,
“responses”: [
{
“took”: 2,
“timed_out”: false,
“_shards”: {
“total”: 1,
“successful”: 1,
“skipped”: 0,
“failed”: 0
},
“hits”: {
“total”: {
“value”: 1,
“relation”: “eq”
},
“max_score”: null,
“hits”:
},
“aggregations”: {
“3”: {
“buckets”: [
{
“4”: {
“5”: {
“buckets”: {
“data.serverId:1”: {
“1”: {
“value”: 0
},
“doc_count”: 0
}
}
},
“doc_count”: 0
},
“key_as_string”: “1687842000000”,
“key”: 1687842000000,
“doc_count”: 0
},
{
“4”: {
“5”: {
“buckets”: {
“data.serverId:1”: {
“1”: {
** “value”: 3**
** },**
** “doc_count”: 1**
}
}
},
“doc_count”: 2
},
“key_as_string”: “1687845600000”,
“key”: 1687845600000,
“doc_count”: 1
},
{
“4”: {
“5”: {
“buckets”: {
“data.serverId:1”: {
“1”: {
“value”: 0
},
“doc_count”: 0
}
}
},
“doc_count”: 0
},
“key_as_string”: “1687849200000”,
“key”: 1687849200000,
“doc_count”: 0
}
]
}
},
“status”: 200
}
],
“$$config”: {
“url”: “api/datasources/proxy/uid/cb4bfb6e-5d83-4546-b47e-8a453a32b518/_msearch?max_concurrent_shard_requests=5”,
“method”: “POST”,
“data”: “{"search_type":"query_then_fetch","ignore_unavailable":true,"index":"my-index-000002"}\n{"size":0,"query":{"bool":{"filter":[{"range":{"collectionTimestamp":{"gte":1687842000000,"lte":1687849200000,"format":"epoch_millis"}}}]}},"aggs":{"3":{"date_histogram":{"field":"collectionTimestamp","min_doc_count":"0","extended_bounds":{"min":1687842000000,"max":1687849200000},"format":"epoch_millis","fixed_interval":"1h"},"aggs":{"4":{"nested":{"path":"data"},"aggs":{"5":{"filters":{"filters":{"data.serverId:1":{"query_string":{"query":"data.serverId:1","analyze_wildcard":true}}}},"aggs":{"1":{"sum":{"field":"data.documents"}}}}}}}}}}\n”,
“hideFromInspector”: false
}
}
}
I have no idea what (if anything) I’m doing wrong.
Please help,
Ivan


