Hi, everyone!
I have started to use grafana a while ago. Simply, interesting and useful, no doubt.
But I faced a little problem (actually dunno if it’s a real problem or I am a newbie)
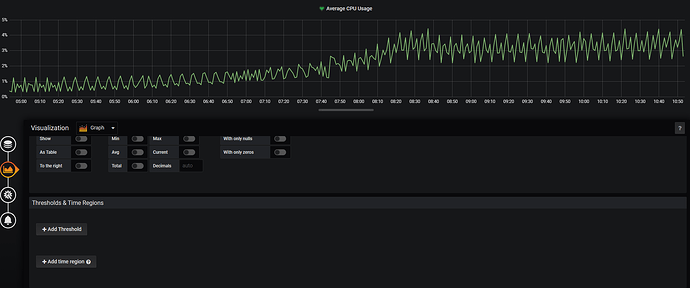
So, I’m using simple “Graph” panel for Average CPU Usage.
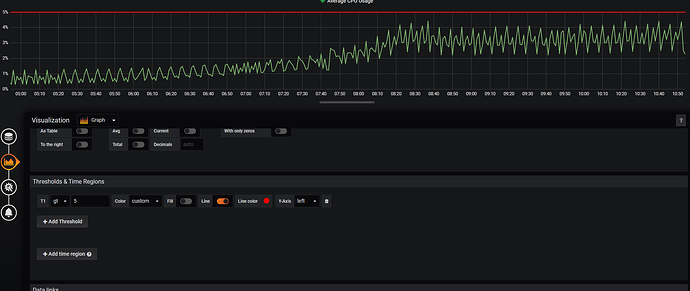
There is no need in thresholds on panel, thus I turned it off. BUT! Everytime when I’m refreshing dashboard or get back to edit this panel - wild threshold line appears again!
I even deleted it from JSON, but this little parasite appeares anyway.
- Removed threshold;
- Get back to “edit” after refreshing.
Will be glad for any help.
Thank you!
Hi!
Which version of Grafana are you using?
I feel like it may be because you have an alert on your panel but it’s a behavior you can’t have on the last version of Grafana because you can’t access the thresholds tab if you have an alert rule configured.
Does the threshold disappears if you delete your alert rule?
Hi!
I’m using grafana 6.6.1 and Zabbix as datasource.
I saw in documentation that “Alert rules” are not supported when you are using Zabbix. So it should not even appears.
In Alert rules there is rule for storage. Seems it has influence on other dashboards too?
Noticed, that there is another ‘always appearing’ threshold in Memory Usage Panel.
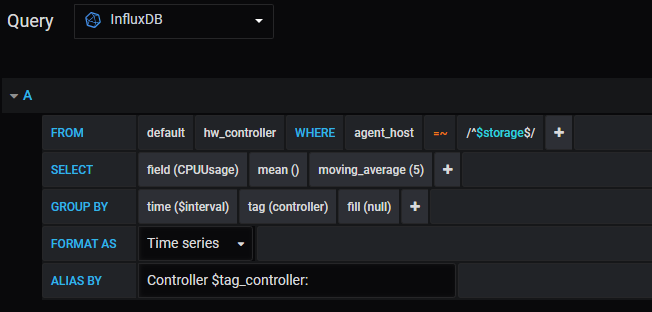
~Attached screenshots with panels and query from alert rule.
Thank you!

There is one easy way to create a copy of that panel or dashboard and delete alert from it .
I’ve never used Zabbix but I can try to help anyway. Can you post a screenshot of your alert tab? You must have something there otherwise you wouldn’t have the heart next to the panel title.
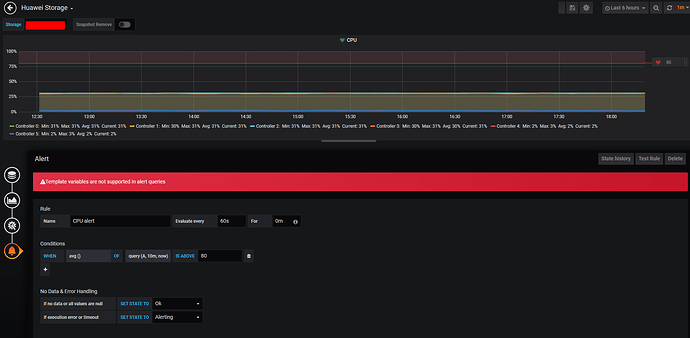
When I am going into ‘Panel - Edit - Alert’ - there is an ‘error’. (screenshot1)
And alert tab (scrn2) connected to other dashboard (HW storage).
Summary - I have ONE dashboard ‘HW storage’ which is connected with ‘alert rule’(which should look up only CPU Usage?, because of It query).
But this ‘alert rule’ affects on other panels on other dashboards! Including Memory Usage.
Hi!
You say the alert rule affects the other dashboard so if you remove it, do all the thresholds disappear?
Hi there!
I ‘paused’ that alert rule, then deleted once again appeared thresholds, they dissappeared untill I will refresh the dashboard.
After refreshing or getting into ‘edit panel’ thresholds appears in CPU Usage and Memory Usage panel.
