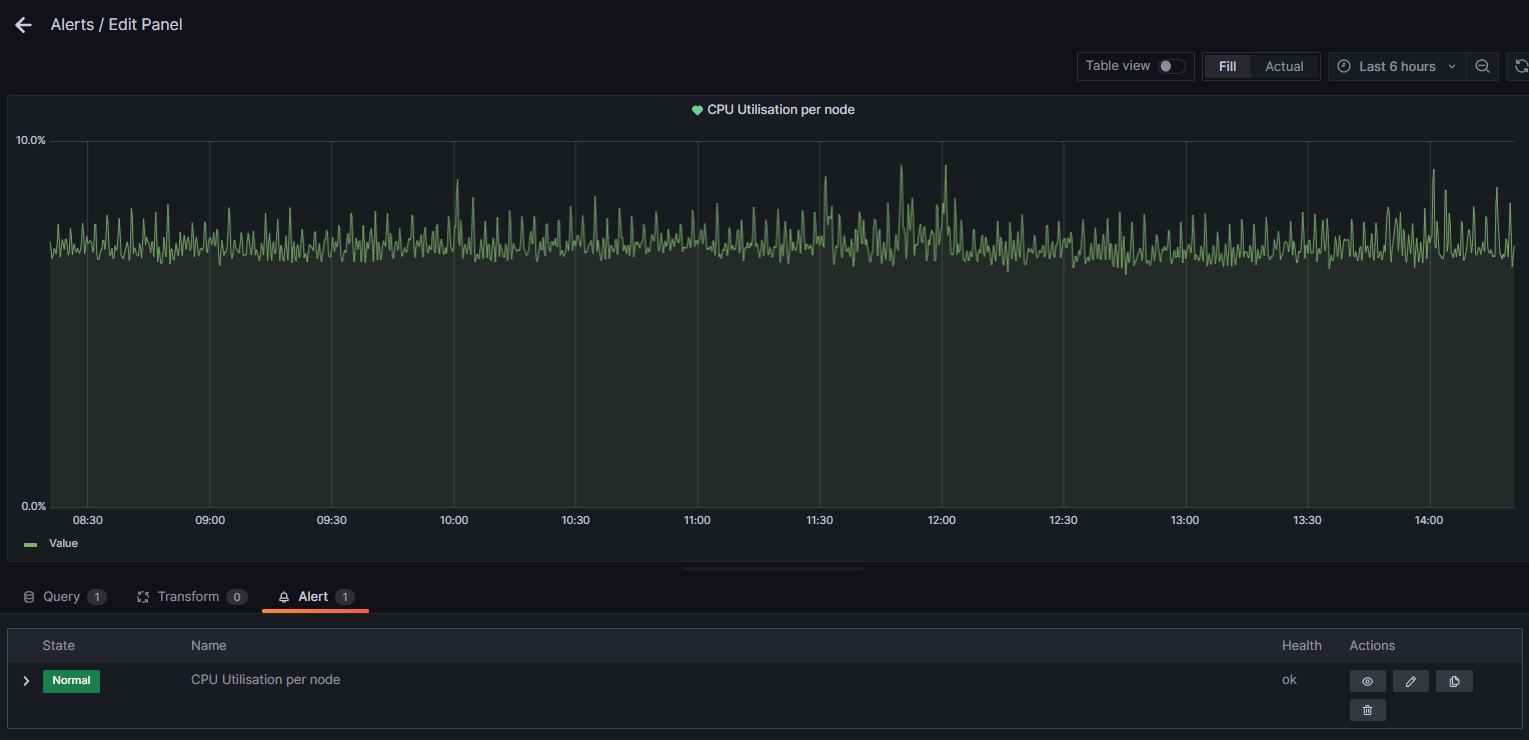
I’ve returned to Grafana having not used since v7. In v9.4.7 (latest), alert threshold lines are no longer displayed on chart panels. They preview fine in the alert rule:
I’d like to be able to quickly visualise proximity to alerts in dashboards without having to edit & preview alerts. “Alert thresholds” are enabled in this panel:
I am afraid this feature belonged to the old graph panel which is now deprecated, and it is not available in the current time-series panel
As a workaround, you can manually create a threshold and give it the same limit that your alert rule has. It’s manual work and not ideal but I could not think of any other visual way to get a line in the panels.
Not very DRY Antonio. Grafana is a visualisation tool, and it’s no longer possible to see alerts in panels. Quite a major regression, no?
This along with the fact it’s now impossible to edit provisioned alerts nor export them (individually) into code, means from where I’m sitting, Unified Alerts are a step backwards. I can see people like me being stranded on v9.x (which still supports Legacy Alerts) for a long time - until Unified Alerts are equally gitops-friendly and observable.
i reached out internally and it turns out that there is actually a PR in place that will add threshold visualisations. so there is no need to edit an alert rule to view the thresholds.
Revisiting unified alerts after a hiatus using “legacy” alerts. Still can’t get alert threshold to display in charts. Tried Prometheus and GCM datasource graphs. Is this still broken? If so, I’ll return to “legacy”.
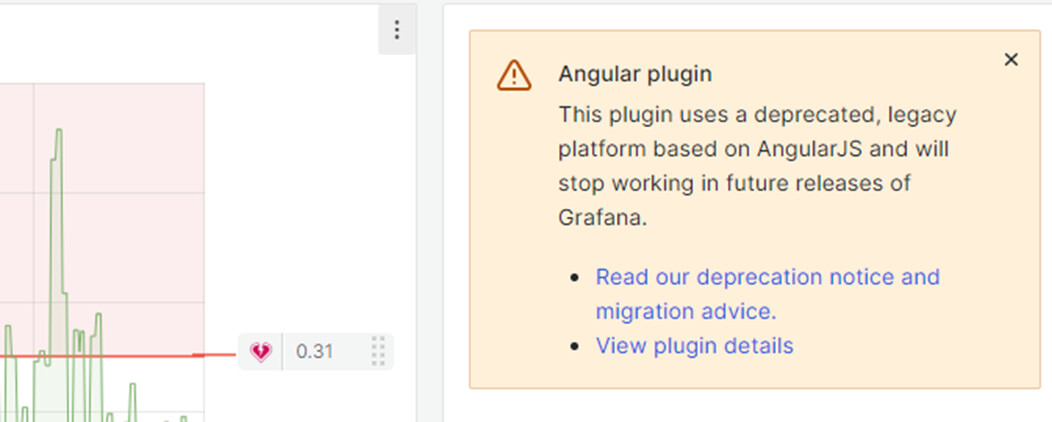
“is not available in the current time-series panel” - indeed, workaround is changing panel’s “type” to “graph” in the dashboard json. Hardly intuitive. You can’t select graph panel type from within the panel UI:
and you’ve deprecated this type, so after changing the json to “graph”, see a warning:
I can’t see any open issue for introducing alert thresholds to timeseries panels. Closest I’ve found are:
My javascript isn’t good enough to figure whether there’s a workaround from these. Any suggestions @antonio or should I create a new bug fix issue? I hope you’re not going to remove graph panels until there’s a way of viewing alert thresholds without them.