-
What Grafana version and what operating system are you using?
-Prometheus 2.42.0+ds-5+b6
-Grafana 12.1.0
-Debian 12 bookworm -
What are you trying to achieve?
-I want to use operato windrose plugin -
How are you trying to achieve it?
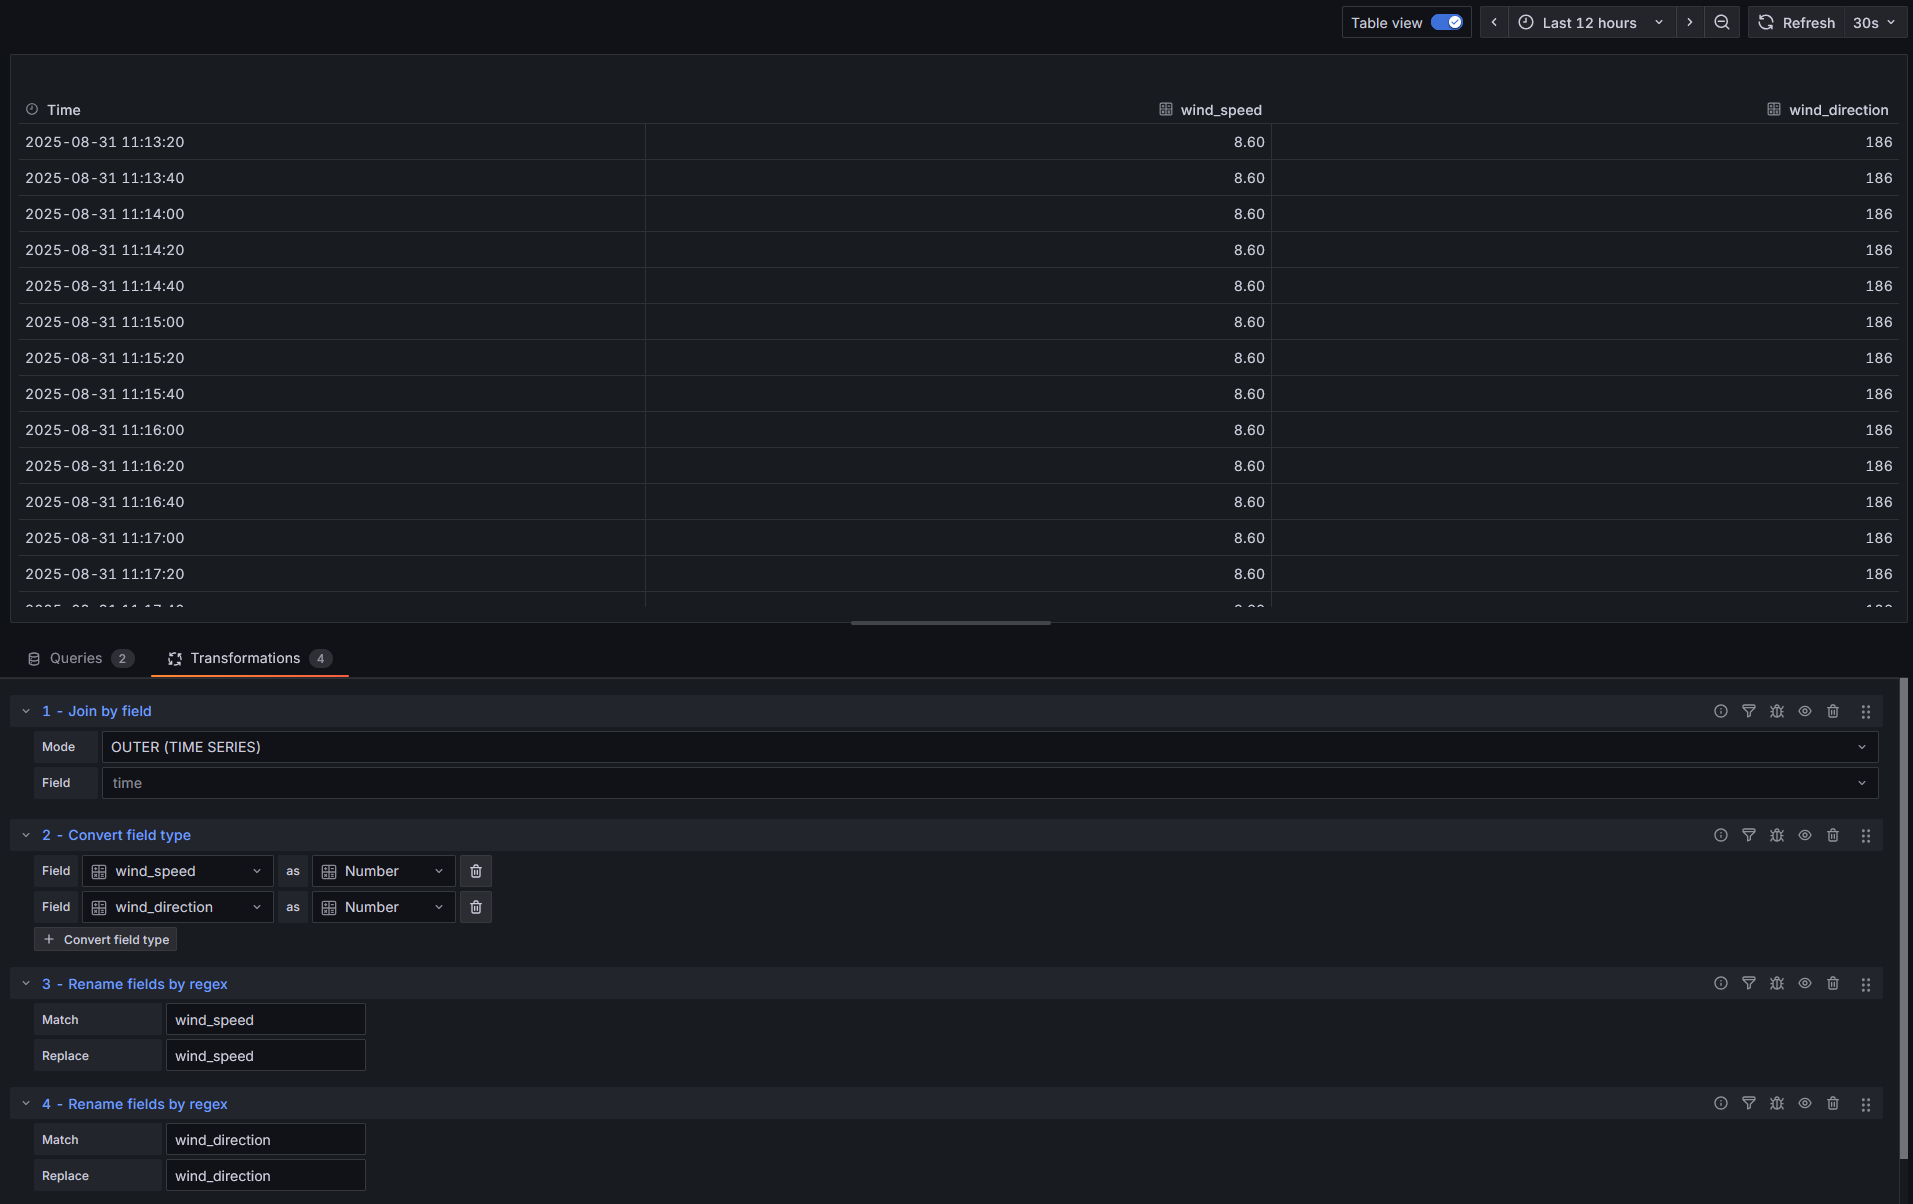
-do query
-do transform
-result in table view
-
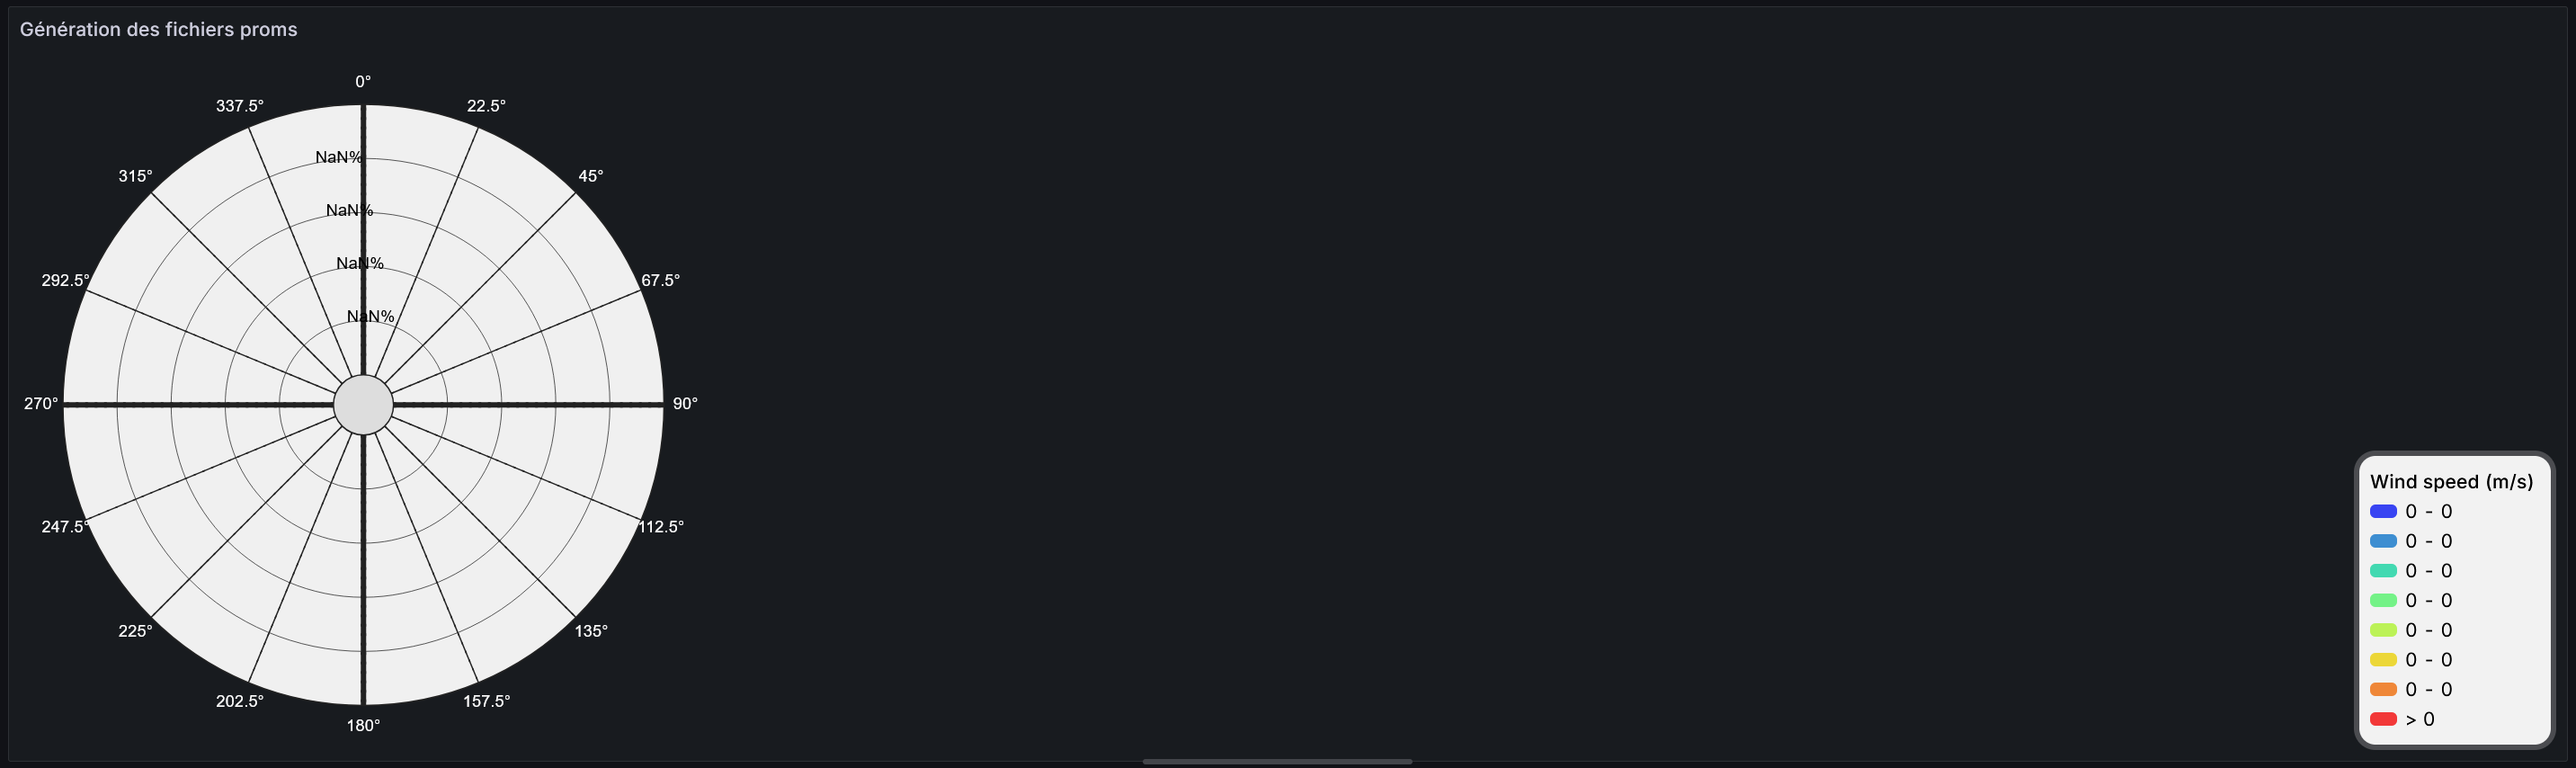
What happened?
-nothing
-
What did you expect to happen?
-see my data in this graf. -
Can you copy/paste the configuration(s) that you are having problems with?
-see chapter “How are you trying to achieve it?” -
Did you receive any errors in the Grafana UI or in related logs? If so, please tell us exactly what they were.
-UI tell nothing. Where can I see log ? -
Did you follow any online instructions? If so, what is the URL?
-yes this : Operato Windrose with influxDB query not showing values - #22 by srfaudio


are you using business chart as the plugin? or something else
Hello,
First, thank you very much to respond me.
I use Operato Windrose pluggin. [source : Operato Windrose plugin for Grafana | Grafana Labs ]
I know not if it is a business chart.
1 Like

Me too, I don’t understand why.
It’s because this I ask help here.
so i emulated your data using csv data and infinity plugin

datasource

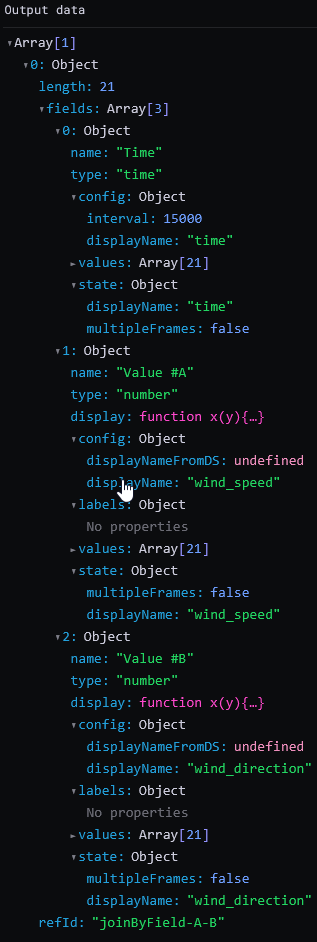
Not sure what the root cause issue could be, can you try using Convert field type and see if that fixes it


:)![]() We are having a wind storm up here in southern Mars
We are having a wind storm up here in southern Mars

Is it possible there are some undefined values in your data? Like no wind_speed or wind_direction for some time or something like that?
Hello,
First, thank you very much to respond me.
No, all value are ok for me (the “OUTER” don’t protect me for this use case ?)
on 5 minutes


Try a clone of the same dashboard with static data using static datasource with same windrose plugin and see if it still works