Need help understanding y-axis values after sum(application) group by, and how to create an alert on no events in last X hours

  • What Grafana version and what operating system are you using?

Grafana v8.0.3

  • What are you trying to achieve? What happened? What did you expect to happen?

We have a cron job that runs every 2 hours, creating a CronSucceeded event at the end of each run. We would like to be alerted when there has been no CronSucceeded event in the past 3 hours.

  • How are you trying to achieve it?

Since the event is a counter, we expect to see increasing steps, which we do:

They “reset” every once in a while because a new host takes over.

Now, I don’t really care which host is performing the job. So I add an aggregator—sum(application) group by.

Okay, they’re now a combined series. But why did the y-axis scale explode? That’s not my actual question, but I’m bringing it up in case it hints at a relevant problem.

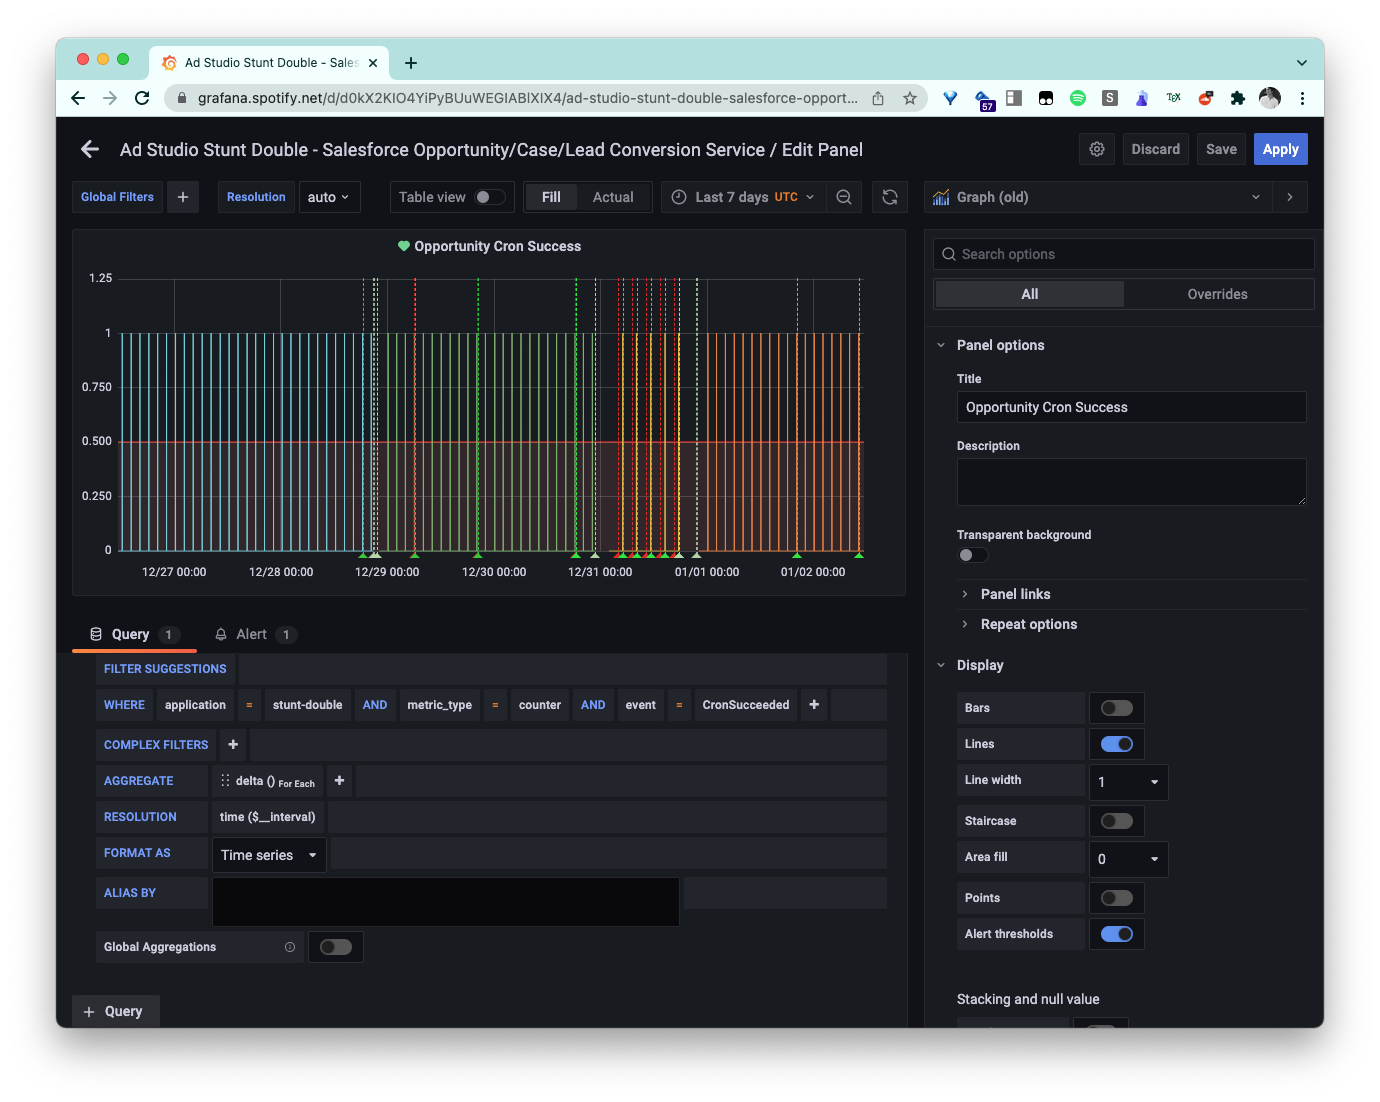
So I decided to abandon that wonkiness and do a delta() for each instead:

(I cannot embed more than 2 images as a new user.)

Screen Shot 2022-01-02 at 06.20.14|626x500

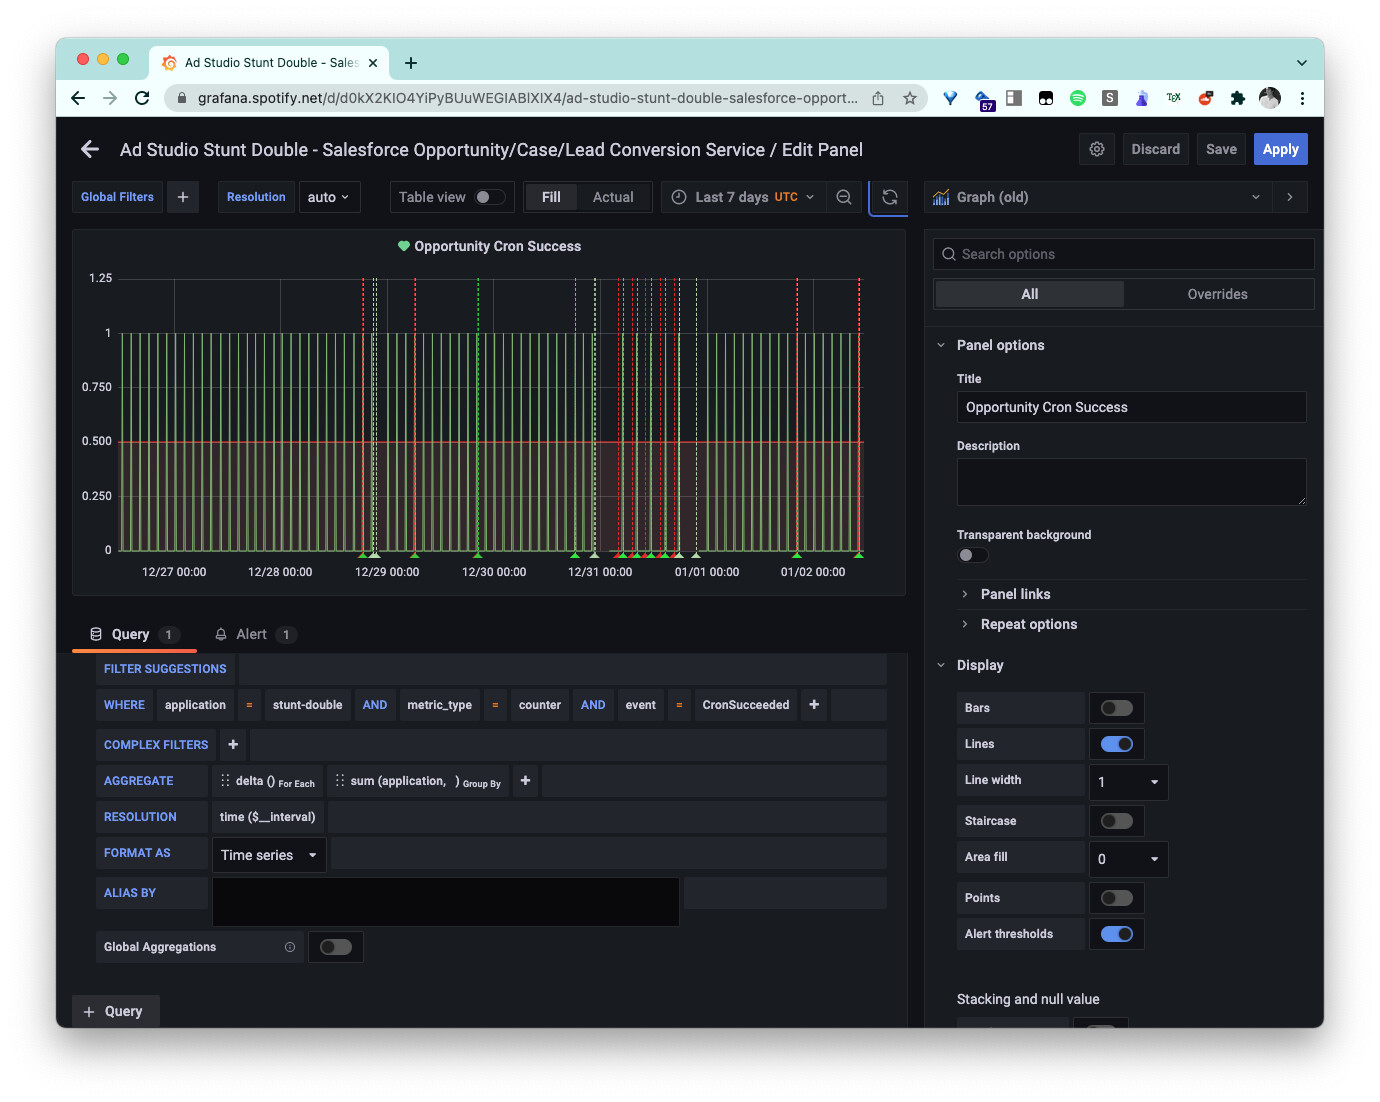
Wonderful, a y-value of 1 every 2 hours is what I expect to see. But okay, now can I do the sum without the y-scale blowing up? Apparently yes.

Screen Shot 2022-01-02 at 06.22.16|626x500

Now, my actual question. I want to set up an alert that looks for an event (y=1) in the past 3 hours, i.e. query(A, 3h, now).

(I cannot embed more than 2 links as a new user.)

upload://awGy3IyfZPyW7hF6lxisEzlHFSe.jpeg (See reply below.)

But this alert has been going off seemingly randomly. (Of course it’s not random, but I don’t understand.) If I zoom into one of the alerted situations…

upload://yqRH4ufh8Ba5SiN3EoSAnKs0nJ9.jpeg (See reply below.)

…I can guess that the last() value after each of those peaks might indeed be 0, not 1. So I probably have to do this another way. (Another side question: Why is last() my only option for WHEN?)

How do I set up the alert I want? To repeat: Alert when there has been no CronSucceeded event in the past 3 hours.

If someone could shed some light on that as well as my intermediate questions, I’d be indebted. Thank you in advance.

  • Can you copy/paste the configuration(s) that you are having problems with?

N/A

  • Did you receive any errors in the Grafana UI or in related logs? If so, please tell us exactly what they were.

I don’t believe so.

  • Did you follow any online instructions? If so, what is the URL?

Nope.

1 Like

Here are the last 2 unlinked images:

Hello and welcome to the Grafana forum.

First of all, you wrote an excellent description of your problem, so someone should be able to help.

Just to keep things inching along, does any message appear when you click on the red triangles?
image

Hi, thanks for the welcome! Yes, on mouseover, I see the following:

OK, let’s try throwing some stuff at the wall and see if anything sticks…

I noticed no Transform tab in your screenshots. If you change the visualization from Graph (old) to Time Series, do you see anything like this?

Try changing to Time Series and then see how your query or alert is affected (if at all), and if the Transform tab appears.

No Transform tab and looks the same to me, including re-creating an alert.

Is this the datasource you are using? Acc. to the Github page, this plugin is compatible with Grafana versions 6.0 → 6.5.2

My rationale was to try to do the aggregation in the Transform and see if that helped explain the results you were seeing…

…because perhaps this query A (with the Delta & Sum functions)

…was packing too much and the alert was picking up false positives.

My gut feeling here is that Grafana’s alerts are fine tuned for certain datasources (like InfluxDB), but not all datasources. Heroic datasource might be one that causes the alert to show a false positive due to some minor line of code.

Hi, sorry I never followed up!

Yes, that Heroic is the datasource we’re using—but you’re looking at a public repo that we eventually stopped open-sourcing, while development has continued internally and does support Grafana 8. But this sent me down a useful path:

Digging into our docs on Heroic and Grafana integration, I came across a bit about how we’re using a variable $resolution (which has a list of supported intervals) from which a “good” interval is automatically picked by Grafana depending on the zoom-level. I looked at what this “Interval” is set to—for example from one of the previous screenshots:

image

And also saw in our docs:

The resolution controls the size of the bucket and applies the first aggregation to rollup the data. A low resolution ensures values will not impacted by the rollup. Usually a value of 1m is sufficient.

I fixed that resolution to 30s, and the y-axis stopped being strange.

Separately, I found how to get the alerts I wanted. The key was to fix the aggregation resolution to 3 hours. Since the cron job should succeed at least once every 3 hours (if not twice), there is no longer an empty “bucket” of 3 hours. I can simply check that the last() value isn’t below 1. This diagram by my company really helped me understand:

Anyway, thank you for the support! Looking forward to chatting again.

1 Like

@acheong87 Thanks for the summary recap.