Hello,
i’m using multiple queries and a table to visualize.
But yesterday these queries A and B (and C etc…) would automatically be put below eachother, real smooth and handy.
like this:

You can see its every row is a different query.
Today when i tried the same (i had to reset my grafana dashboards)
they dont show up below each other but i get a dropdown button for query A or B and so on like this:
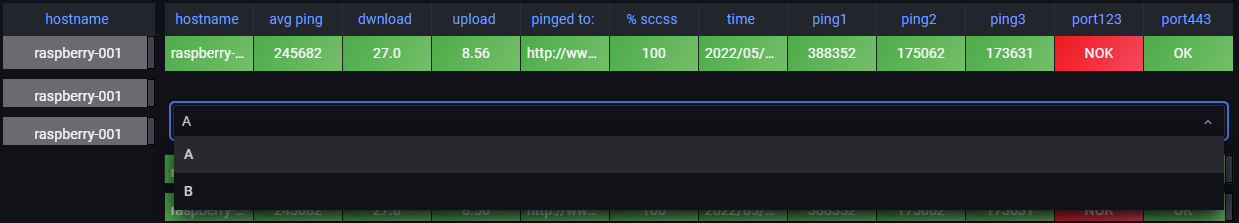
but this is so unhandy and ugly, how can i have the same result as yesterday??
I just want A and B below eachother like the first picture, please help!