I have zabbix using snmp to get metrics from a ruckus zonedirector.
For the Access points there are 3 metrics I would like to have in one table.
These are listed as a separate metric for each ap.
AP MAC Address: Name
AP MAC Address: Auth Clients
AP Status MAC Address
I would like to have a table that shows all the Access points like this
AP Name | Status | Auth Clients
AP1 | Connected | 5 Clients
AP2 | Connected | 30 Clients
AP3 | Disconnected | 0 Clients
Is this possible?
Hi! Unfortunately, it’s not possible now.
I also have a mysql connection to zabbix setup in grafana. Is it possible to do in this?
Yes, it’s possible, but tricky a bit. You should write proper SQL query for this.
Hi! Is it still impossible to do this with Zabbix in Grafana?
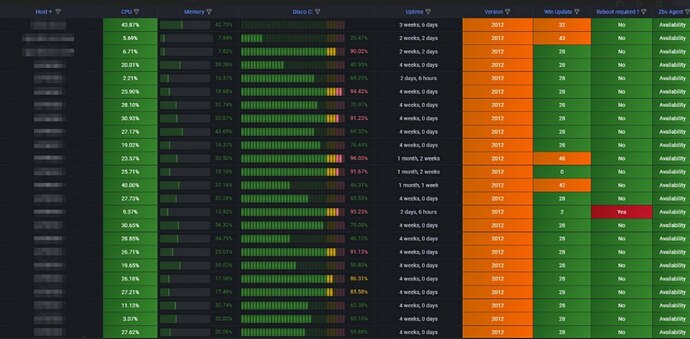
Since the features of transformations was been introduced, now it’s possible, you can try playing arround with Grafana transformations, using the original question about the AP’s three column table information, you could do three queries, one for each column and use this transformation recipe:
- Prepare time series with Format “Multi-frame time series”
- Reduce with Mode “Reduce” and Calculations “Last *”
- Labels to fields with Mode “Columns” and Labels in “host” e “item”
- Merge
- Organize fields to rename the columns the way you want to show it.
After that you can play arround with some Overrides, like in the image bellow:
Closing it since it’s an old topic. Better discuss if needed in a new one.
