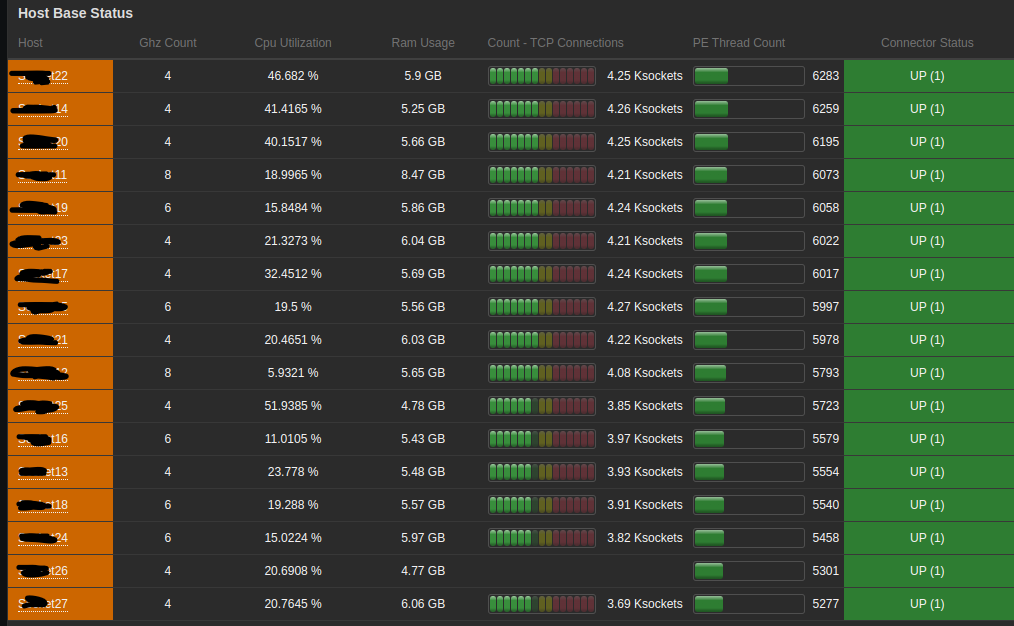
We want to use a table as I drew in picture. Our datasource is Zabbix.
I have been searching a way to show our host like that but cannot find any solution.
( columns in my drawing are for example. They can be changed. )
Is it possible to do that table with Grafana?
Edit: Names in hostname column would be host001, host002, host003… I forgot to increase hostname numbers
First, please try not to “revive” old conversations (This one is a year and a half old) and prefer to open a new one with your own question and needs.
Second, the panels in Grafana directly depends on the Datasources, queries and overrides used, that changes depending on how the data has modeled, and since we’re talking about Zabbix here, also the Template changes all the outcomes.
I’ll close this topic for now, but I’ll leave you with this recipe to do the same idea on what has done on the table on this topic. If you got any questions, try to open your own topic ok?
I believe that this is the answer for the OP, @herbokolog, too.