This is a short but detailed example of how to get MQTT data into GRAFANA using the MQTT data source. Whilst there are several examples they all lack detail so I thought I would cover this.
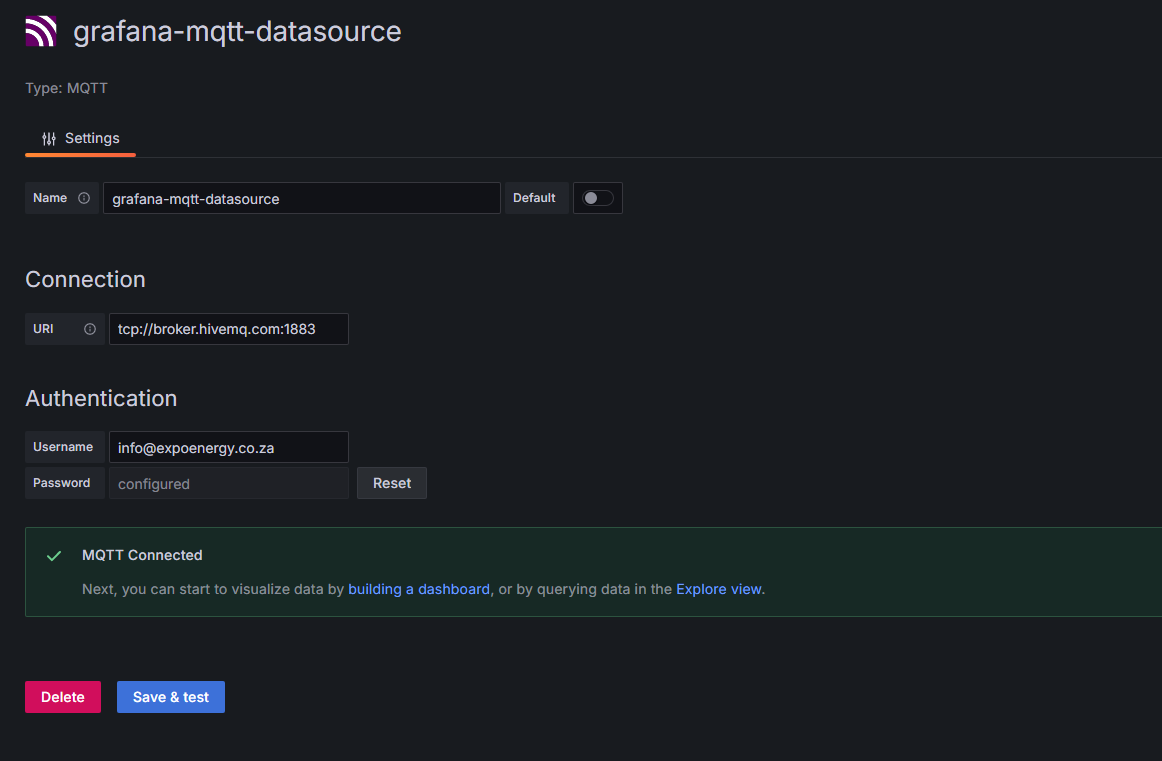
I have an electrical meter with MQTT feature enabled. I used the HIVEMQ Public Broker tcp://broker.hivemq.com:1883 and it connected no problem. It requires no user credentials, SSL/TLS or Last Will and Testament (LWT). However HIVEMQ requires one to login with username and password and it is these details which the GRAFANA data source requires to connect to its the public broker. One does not connect direct to the meter but rather indirectly via the public broker. So the meter authentication details and broker authentication details are separate
I just defined a TOPIC name in the meter (one may use any name) and selected the Phase Voltages (Van,Vbn,Vcn and Vavg)
Having done this the meter then automatically sends data to the public broker. Thus to get data into GRAFANA one just has to connect to the public broker as shown below and by entering the Public Broker Authentication details it will connect as shown below.

Once connected one may then build a Dashboard as shown below in edit mode.
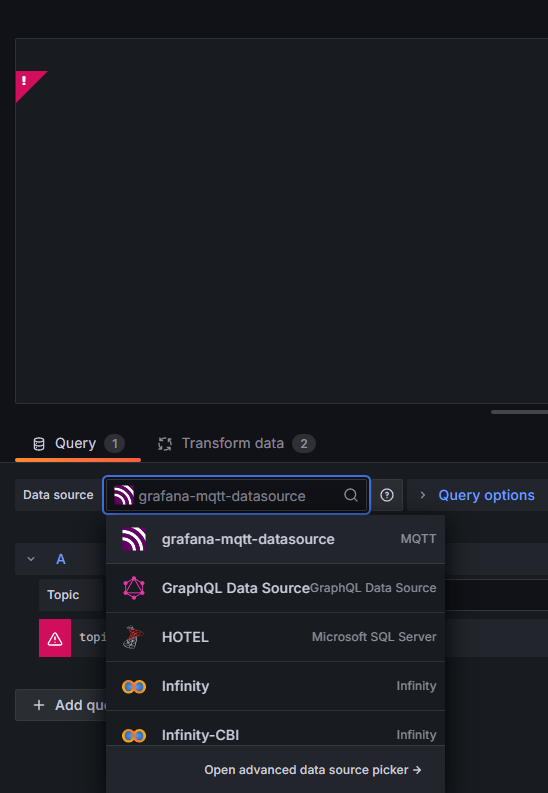
One may then simply select the grafana-mqtt-datasource as shown below
One may then simply enter the meter topic name and one then gets weird table data coming through as shown below.

This is because the meter sends out JSON formatted data with a timestamp in unix second time and several objects and which is plain Greek to most of us.
If one examines this GRAFANA Table data as a formatted JSON message then one can see the timestamp, gateway object and device object more clearly
{
“timestamp”: 1713884010,
“gateway”: {
“name”: “AXM-WEB2”,
“model”: “AXM-WEB2”,
“serial”: “AN21114212”
},
“device”: {
“name”: " LOGGER CADOGAN",
“model”: “Acuvim-II”,
“serial”: “AHB52401107”,
“online”: true,
“readings”: [
{
“param”: “V1”,
“value”: “238.201”,
“unit”: “V”
},
{
“param”: “V2”,
“value”: “236.124”,
“unit”: “V”
},
{
“param”: “V3”,
“value”: “235.074”,
“unit”: “V”
},
{
“param”: “Vnavg_V”,
“value”: “236.466”,
“unit”: “V”
}
]
}
}
One simply has to provide the Json path to now filter the desired MQTT data values. By using the data.readings path filter one gets

So what one now needs to do is to replicate this in GRAFANA using the Transform data features.
So by entering the main topic path as used in the meter exposes the entire meter Json data sent from the meter to the Public Broker to the Grafana MQTT datasource as shown above.
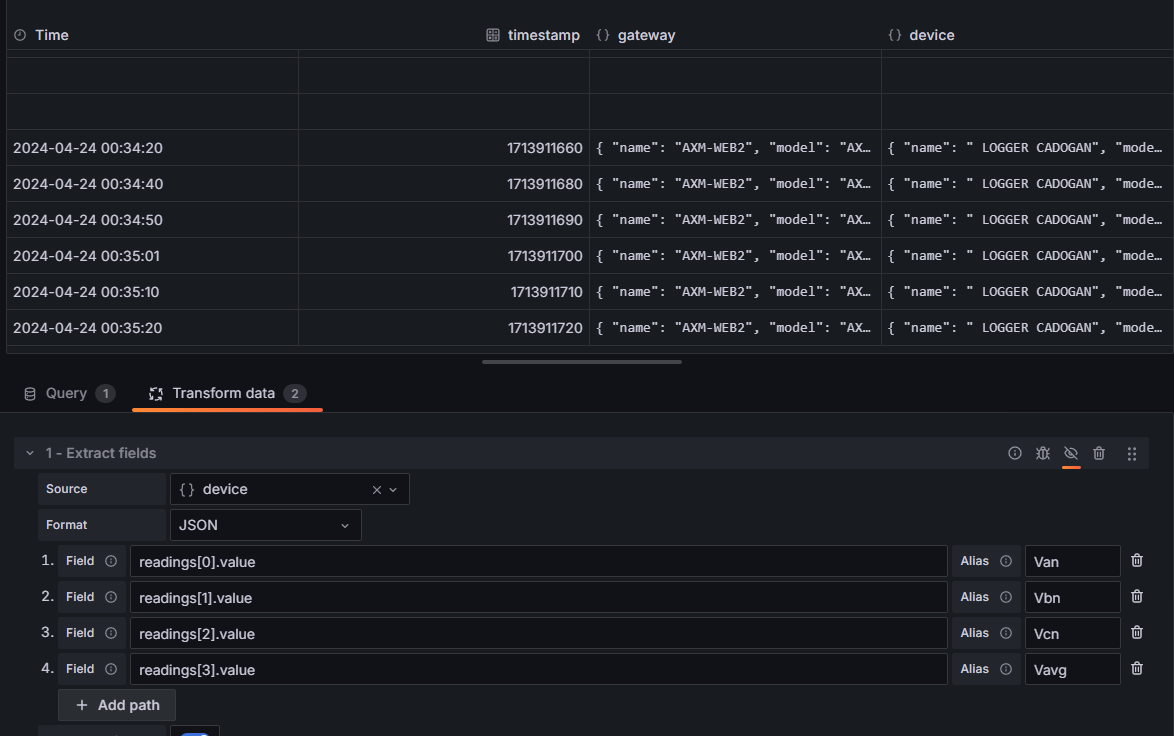
Now as seen above all the meter voltage data resides within the DEVICE OBJECT. So we select the Extract Fields Transformation, select the device object {}device and then select the various fields voltages as shown below.
BEFORE
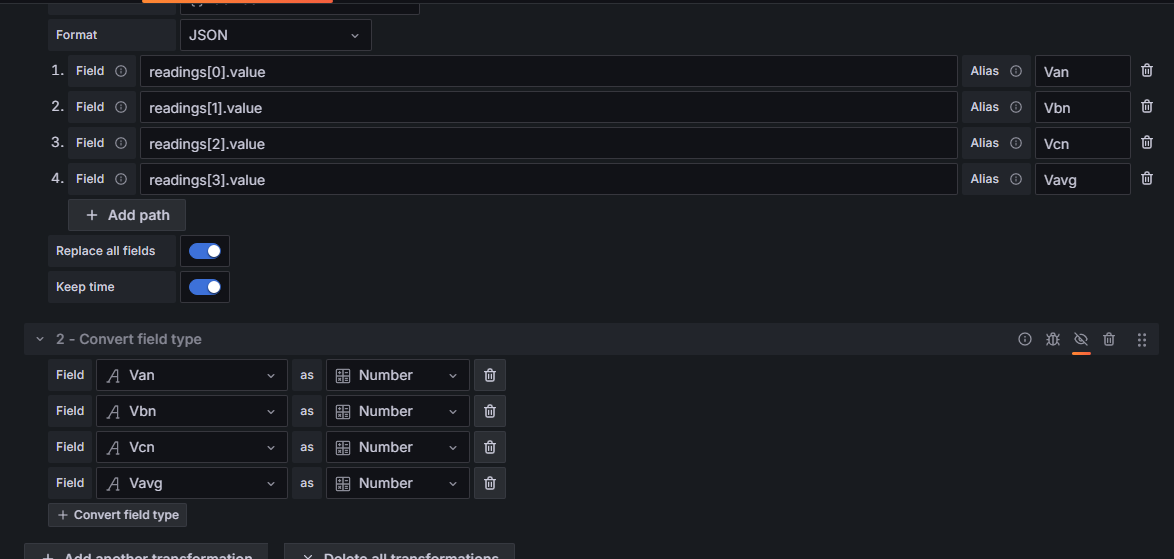
AFTER

Note I used the Replace all fields and Keep time to remove all unwanted data and just keep what is needed for the Time Series Chart.
But we are not finished yet as one can see from above that all the voltage table values are text and must be converted to number so we use then use the Convert field type transformation as shown below.
One that is done we now have the data in the correct format to use the time series chart
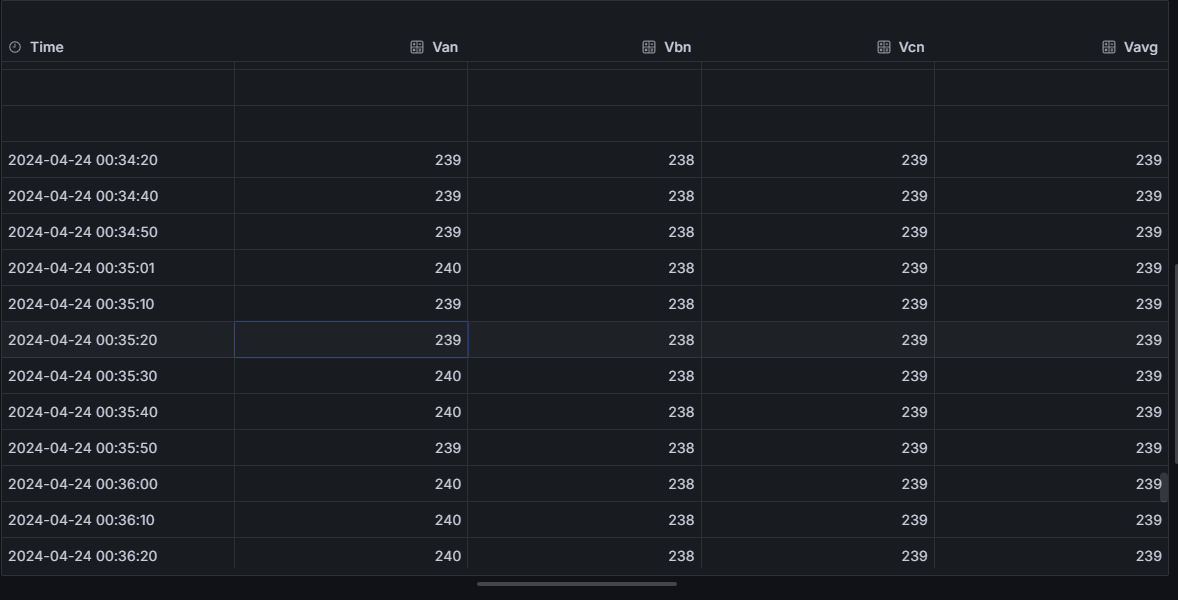
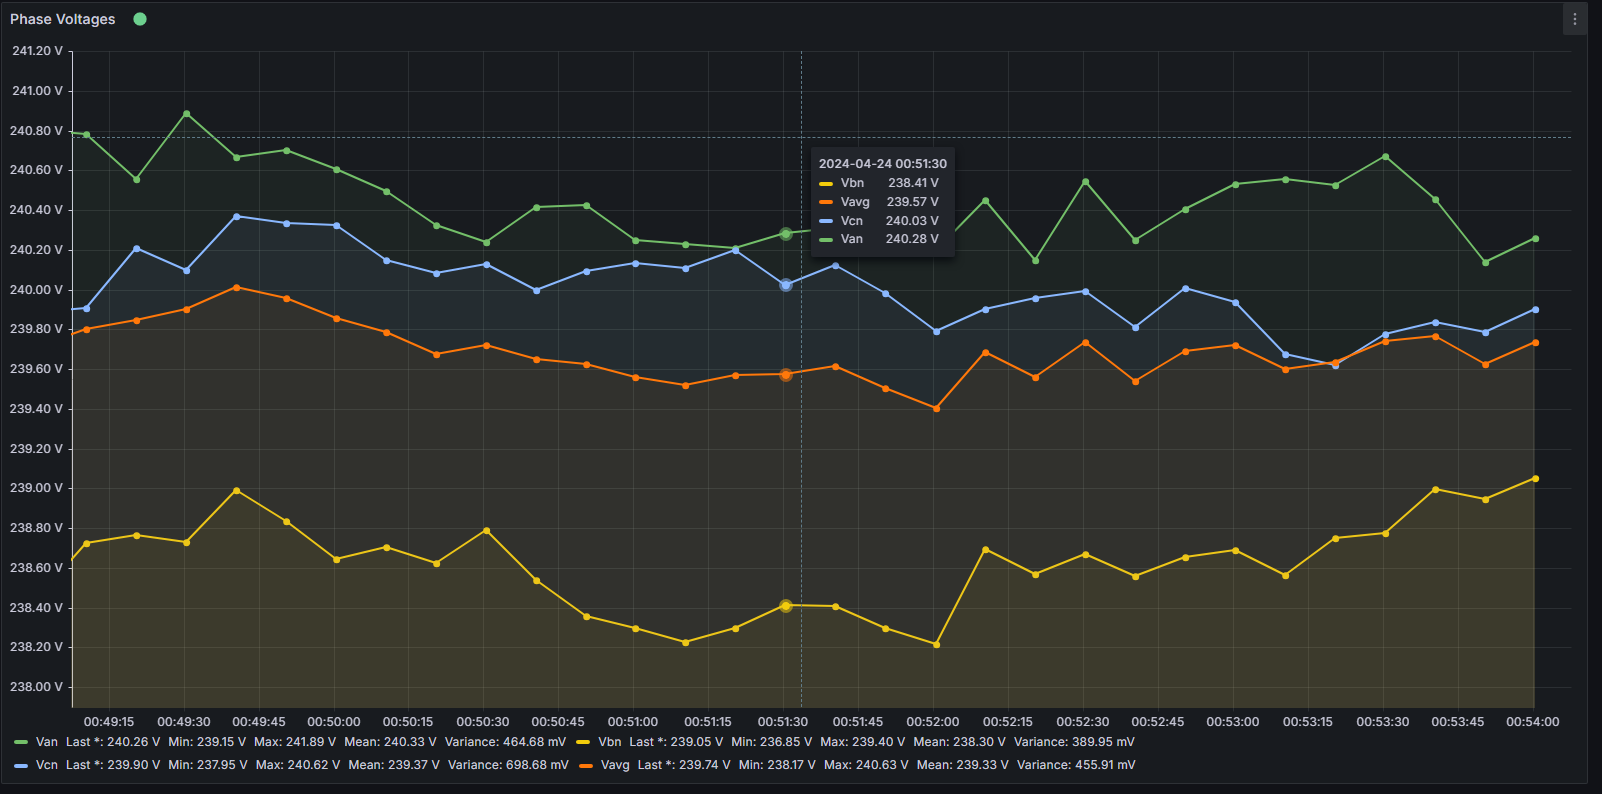
Once we select the Time Series Chart we get
Although this might not be applicable to all instances it provides a simple solid test case for others to work from using a bit sweat.
I used node-red to get the Json data format and then used the Jsonata exerciser to test the path filters.
One may apply the exact same methodology to extract or filter any MQTT Json data