Hello,
I am transferring Kibana dashboards to Grafana. I am achieving this by using Elasticsearch as a data source, copying the query and selecting the same metrics, interval, etc. as in Kibana.
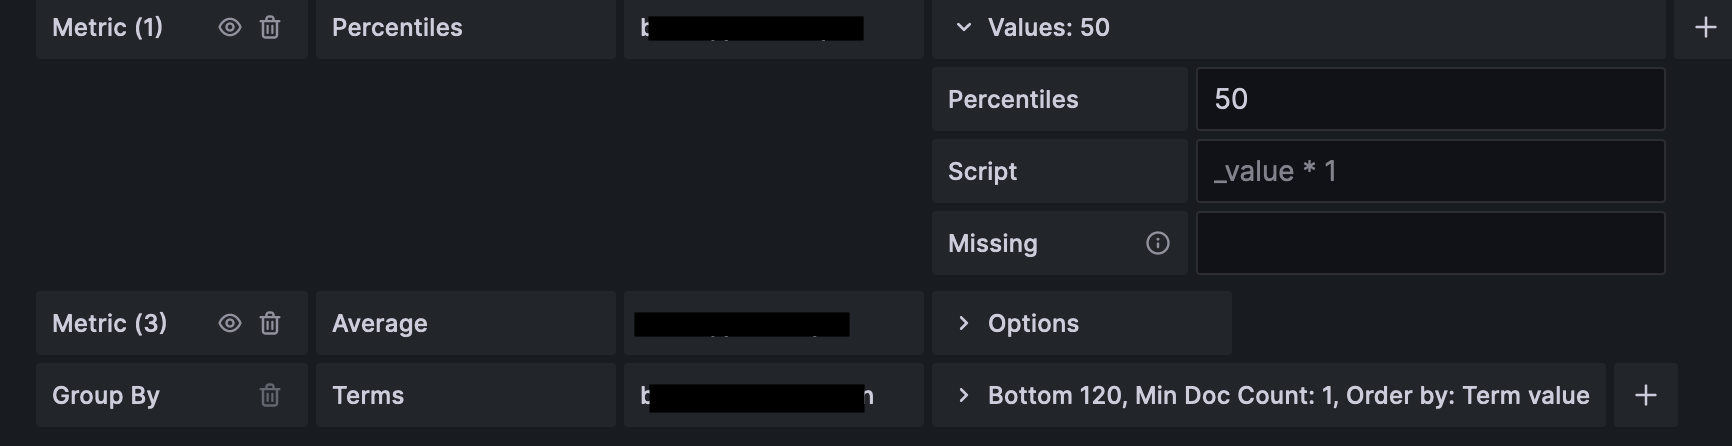
This looks like this:

Unfortunately, one dashboard uses the median aggregation, which I am not able to find in Grafana.

Do you know a solution to this problem or is there maybe a workaround by using expressions? I am using the “Time series” visualization.
Grafana Version 9.0.5