Hello!!!
I am trying to get the 90th percentile value based on the method name using Elasticsearch data source but I could see the Method name coming but the Percentile value always returning as -.
When i check for the response from the Elasticsearch i can see all the 90th percentile values are getting listed in response.
Please share your thoughts
Grafana version : 4.4.3
torkel
August 16, 2017, 5:32pm
2
What does your metric query look like and what does ES return
ES Response :
QUERY:{“size”:0,“query”:{“bool”:{“filter”:[{“range”:{“START_TIME”:{“gte”:“1495128992809”,“lte”:“1502904992809”,“format”:“epoch_millis”}}},{“query_string”:{“analyze_wildcard”:true,“query”:"*"}}]}},“aggs”:{“2”:{“terms”:{“field”:“METHOD_NAME”,“size”:10,“order”:{"_term":“desc”},“min_doc_count”:1},“aggs”:{“1”:{“percentiles”:{“field”:“DURATION_MS”,“percents”:[“90”]}}}}}}
Hello torkel,
Above listed are the metric query and the response i am getting from Elasticsearch.
Please suggest.
Thanks
torkel
August 16, 2017, 7:50pm
6
dont’t know why it’s not working for you, same query works here:
http://play.grafana.org/dashboard/db/elastic-90th-percentile?panelId=2&fullscreen&edit&orgId=1
if yu enable points in the Graph display options, do you see any?
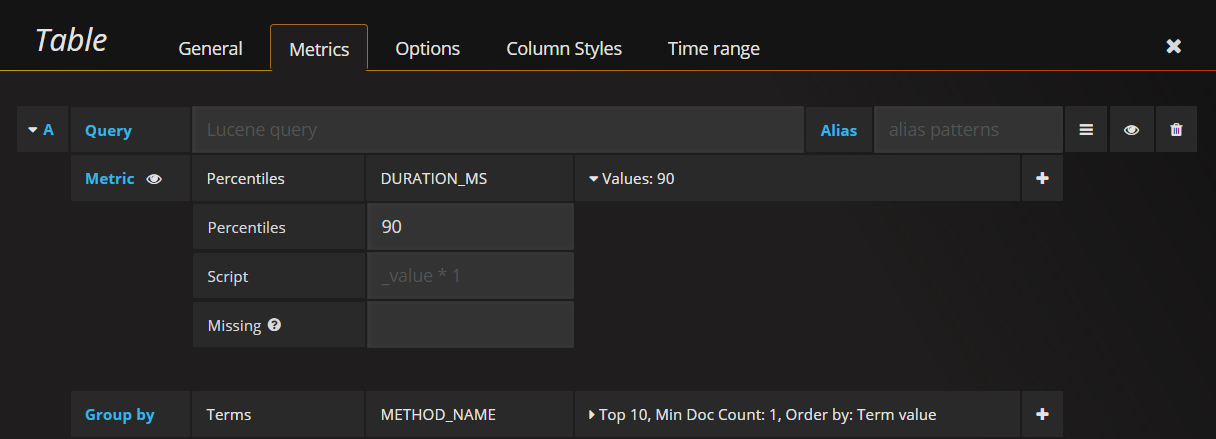
I am trying to create a table with 90th Percentile values against Method name.
Can you please check if you are able to view the 90th percentile values in a Table.
torkel
August 16, 2017, 7:52pm
8
then you will have to to options tab and select the method name and 90th columns using the column + dropdown
I did add the options as required but still i am not seeing the values getting listed under Duration column. PFA
torkel
August 16, 2017, 7:59pm
10
forgot percentiles only works with time series in Grafana (So you need a date histogram aggregation)
I tried this option. When i add the Date Histogram the 90th Percentile value always list as NaN. PFA
torkel
August 16, 2017, 8:09pm
12
Strange, that works for me. You probably have to low a date histogram interval. specify a low limit like >5m in the group by time option in below your queries, this sets a low limit for the auto interval
I tried with Interval 1m as well but it is still the same
Please let me know if there is any fix available for this issue
torkel,
Can you please let me know if there is any other options available in Grafana.
Thanks
torkel
August 17, 2017, 7:58pm
16
Its elasticsearch that returns the nulls, try setting min doc count to 1, or increase date histogram interval
The elasticsearch is returning the 90th percentile values as i gave the response details. PFB:
As you suggested, I made the min doc count to 1 and changes the Date Histogram interval to 1d, but no luck.
Torkel,
Please let me know if you have any other options available.
Thank in Advance!!!
torkel
August 19, 2017, 4:55am
19
Your missing date histogram
Thank you for the update!!!
When i am adding the Date histogram I am getting the values listed NaN